Issue Date: Thursday, July 4th, 2019
Issue Time: 9:30AM MDT
Summary:
Southwest flow ushered in a very dry air mass over the state yesterday. Without much instability or lift, afternoon showers and weak thunderstorms were limited in coverage. Without the midlevel energy, storms were only initiated by weak upslope flow favoring the Continental Divide and eastern mountains for storm development. Storms over the high country produced rainfall totals up to 0.25 inches with an ALERT gage capturing 0.20 inches of rain at the gage near Golden Gate Canyon State Park. Totals over Saguache County were estimated up to 0.25 inches by radar. The Apishapa SNOTEL gage in the Southeast Mountains recorded 0.3 inches for the day. As storms tracked into the eastern plains, they didn’t gain much efficiency in rainfall production as it was rather late in the day and better moisture was further east. A CoCoRaHS station in the Black Forest area recorded 0.19 inches for the day. Dense fog was present over the far Northeast Plains this morning thanks to a passing front moistening the lower levels of the atmosphere. As anticipated, flooding was not reported.
Although flows on several rivers and creeks were elevated yesterday, with NWS Flood Warnings issued for the Eagle River near Gypsum and the Arkansas River near Avondale, there was no riverine flooding reports as of this morning. However, it is likely there was ongoing lowland flooding in problematic spots. The Avondale gage remains at the Minor flood stage this morning with other stations in Action stage: AHPS gages
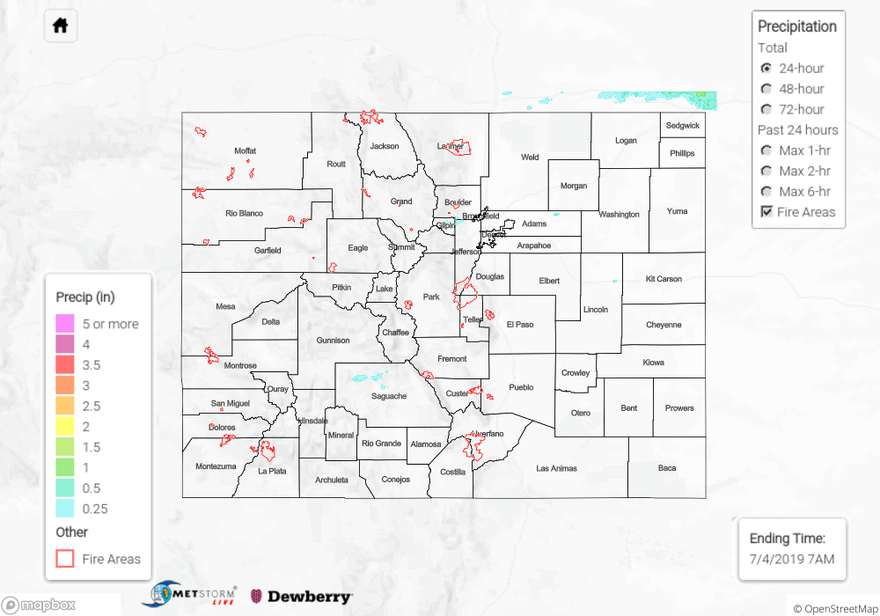
To see estimated precipitation totals over your neighborhood yesterday, scroll down to the State Precipitation Map below.
Click Here For Map Overview