Issue date: Tuesday, July 2, 2019
Issue Time: 12:00 PM MDT
Summary:
Heavy rainfall along the Front Range, Urban Corridor, Northeast and Southeast plains occurred yesterday as a shortwave passed over the state. Ample surface moisture and upslope flow initiated severe thunderstorms over the eastern areas of the high country midday. A surface cold front helped to initiate storms in the eastern plains later in the afternoon. Radar derived rainfall was up to two inches in Kiowa and Cheyenne Counties. There were multiple reports of flash flooding to the NWS near the Spring Creek burn scar, with one report of waters 3 to 4 feet deep over county road 443. In Left Hand Canyon in Boulder County near Gold Hill, mud and rocks washed onto the road after reported rainfall of 2.13 inches. Heavy rainfall associated with slow moving, severe thunderstorms was reported all along the Front Range and Urban Corridor. Hail of 1.25 inches was measured in northern Weld Country and hail up to 1 inch in Arapahoe County near Aurora.
Rivers remain high throughout the high country due to snowmelt and rainfall over the last three days. Flows along the Arkansas at Avondale reached Minor flood stage yesterday due to releases from the Pueblo Dam and rainfall over the area. The gage along the Eagle River near Gypsum also reached Minor flooding yesterday and was only 0.01 inch from breaking the gage height record. Reports from Conejos County within the SLV is still experiencing high water along the Conejos River with flooding at various locations across the county. Terrace and Platoro Reservoirs are also running high, so there will likely be releases, which would cause flooding to already swollen rivers in the area. For local river information that is updated throughout the day, please visit the website of your local NWS office (Boulder, Pueblo, Grand Junction) or track the AHPS gages in your area.
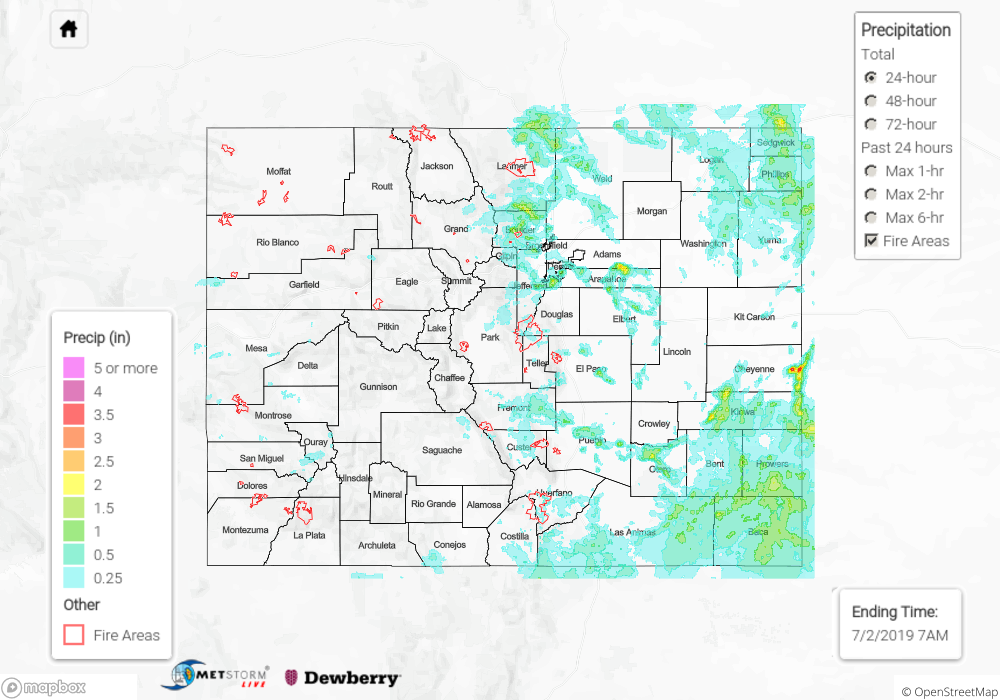
To see estimated precipitation totals over your area on Monday, scroll down to the State Precipitation Map below.
Click Here For Map Overview