Issue Date: Monday, July 1st, 2019
Issue Time: 9:45AM MDT
Summary:
High pressure continued to the main factor driving weather over Colorado yesterday. Therefore, hot temperatures were present before afternoon storms and cloud cover helped cool things. Moisture associated with Alvin moved over the southwest corner of the state, which allowed for multiple rounds of rain showers and weak thunderstorms beginning around 2PM. More widespread coverage of thunderstorms occurred over the eastern mountains due to higher low level moisture. Storms were mostly confined to the higher terrains with additional activity over the Northeast Plains and Urban Corridor. Most storms came to an end a couple hours after sundown, but some light showers continued over the Northeast Plains through 3AM.
As far as rainfall amount, 2-3 hour totals over the Front Range were generally estimated by radar to around 0.6 inches in the storm centers. There was a storm report of 1.06 inches of rain with pea sized hail in Leadville, which was the highest report of the day for a single storm over the mountains. Three CoCoRaHS locations in Vail recorded around 0.85 inches for the day. In Tabernash, a CoCoRaHS station recorded a 1.25 inch total for two storms that tracked through the area. Over the San Juan Mountains in La Plata County where moisture was a bit lower, a SNOTEL station recorded 0.5 inches. Storms that formed over the Urban Corridor and Northwest Plains produced some gusty winds and large hail (up to 1.75 inches). A downburst from a severe thunderstorm near Prospect (Weld County) knocked down a fence along with several branches. Radar rainfall estimates in the area were up to 2 inches.
As far as NWS Flash Flood Warnings, a warning was issued for the Spring Creek burn area at 4:30PM, and a Flood Advisory was issued for a storm around the same time that popped up between Pueblo and Colorado Springs. As of this morning, there were no flooding reports for yesterday.
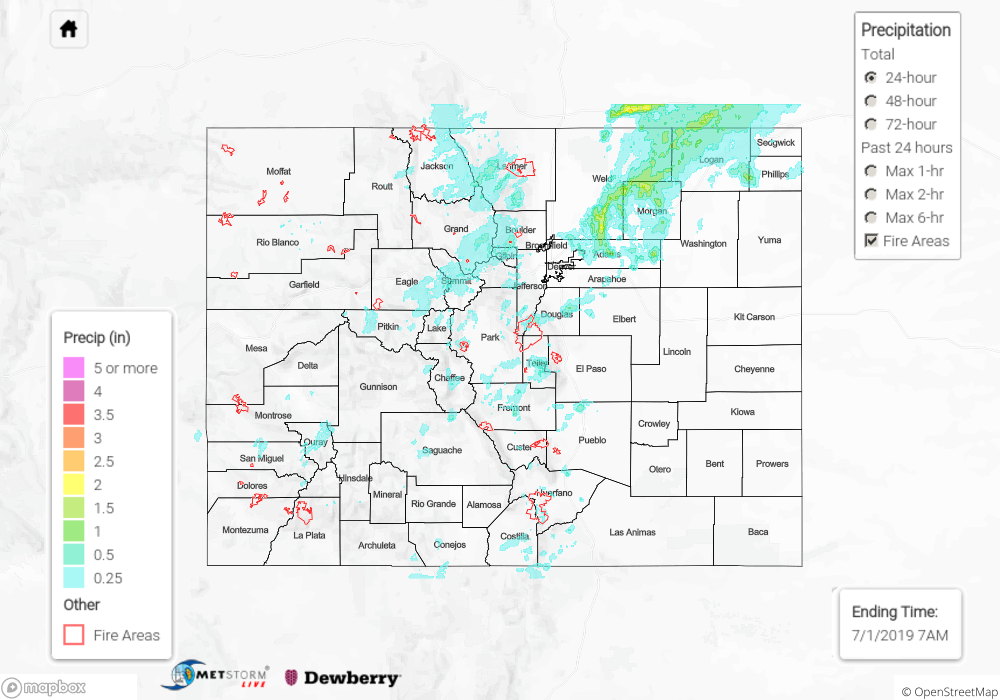
To see estimated precipitation totals over your area on Sunday, scroll down to the State Precipitation Map below.
Click Here For Map Overview