Issue Date: Friday, June 21st, 2019
Issue Time: 10:45AM MDT
Summary:
The system over the Pacific Northwest begin to drop south today to our west yesterday, which turned flow aloft from westerly to more southwesterly. A dry air mass was advected over the southern half of Colorado with the wind shift, which kept storms high-based over the Southeast Plains. A cold front over northwest Colorado helped kick off thunderstorm activity in the late afternoon, which lasted overnight. 24-hour totals over the Northwest Slope and Northern Mountains were up to 0.8 inches with isolated totals up to 1 inch over the Northern Mountains. Overall, a large swath of the area received 0.5 inches of beneficial rainfall with the highest CoCoRaHS report in the area at 1.08 inches (Craig). This storm likely pushed these regions to or above climatological rainfall for June. Storms yesterday also produced some strong gusty winds with the jet over the area. Gusts from 50 to 60 mph were reported with the thunderstorms. Rainfall and snowmelt allowed the Elk River (near Milner) gage to reach the Minor flooding stage this morning. Areal Flood Advisories have been issued for the Northwest Slope and Northern Mountains through Saturday as flows in the area will remain elevated from rain and snowmelt.
To the east, a shortwave combined with diurnal flow, a surface trough and moisture to kick off storms and a couple Severe Thunderstorms over the Front Range and Palmer Ridge by 3PM. 1 inch hail and was reported with the storm that tracked across Weld County with rainfall estimated at 1.5 inches in the core. A CoCoRaHS station in the area recorded 1.18 inches, which is very impressive considering the fast storm motion. Another severe storm tracked east from Denver to Yuma County. It produced golf ball sized hail over Yuma County. The quick storm movement kept 1 hour rain rates around 1 inch, so no flooding was reported as of this morning.
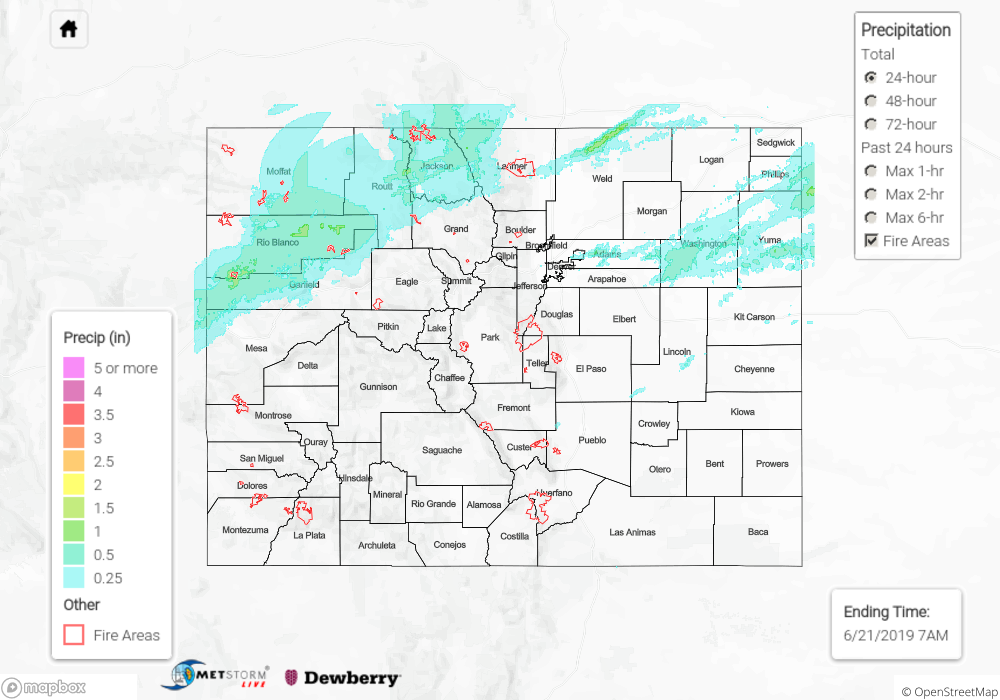
To see estimated precipitation totals over your area yesterday, scroll down to the State Precipitation Map below.
Click Here For Map Overview