Issue Date: Thursday, June 20th, 2019
Issue Time: 10:00AM MDT
Summary:
After a couple days of widespread, heavy rainfall Colorado got a chance to dry out as northwest flow aloft pushed a dry, warm air mass over the state. High temperatures increased statewide with a ~10°F increase over eastern Colorado. Despite a drastic drop off in PW, enough residual moisture remained for some afternoon showers and weak thunderstorms over the western high terrains, Front Range and Northeast Plains. Maximum totals yesterday over the Northern and Central Mountains were just under 0.25 inches with most storms producing between 0.05 and 0.15 inches of rain. The strongest storm of the day was a weak thunderstorm that tracked into northern Weld County from Wyoming. With fast storm motion, only minimal rainfall occurred with radar estimating 0.25 inches of rain under its core. A CoCoRaHS station in Logan County recorded 0.22 inches from the storms and Sterling Airport recorded a wind gust of 24 mph.
The Areal Flood Warnings continued for the San Antonio and Conejos Rivers in southeastern Conejos County, the headwaters of the Rio Grande and in central Saguache County. Emergency management relayed minor flooding of lowland areas to the local NWS offices. Several Areal Flood Advisories also continued for the Central and San Juan Mountains with 10 gages in Action stage. Take a look at the gages here: AHPS Gages. Other than minor lowland flooding from high running rivers, flooding was not reported on Wednesday.
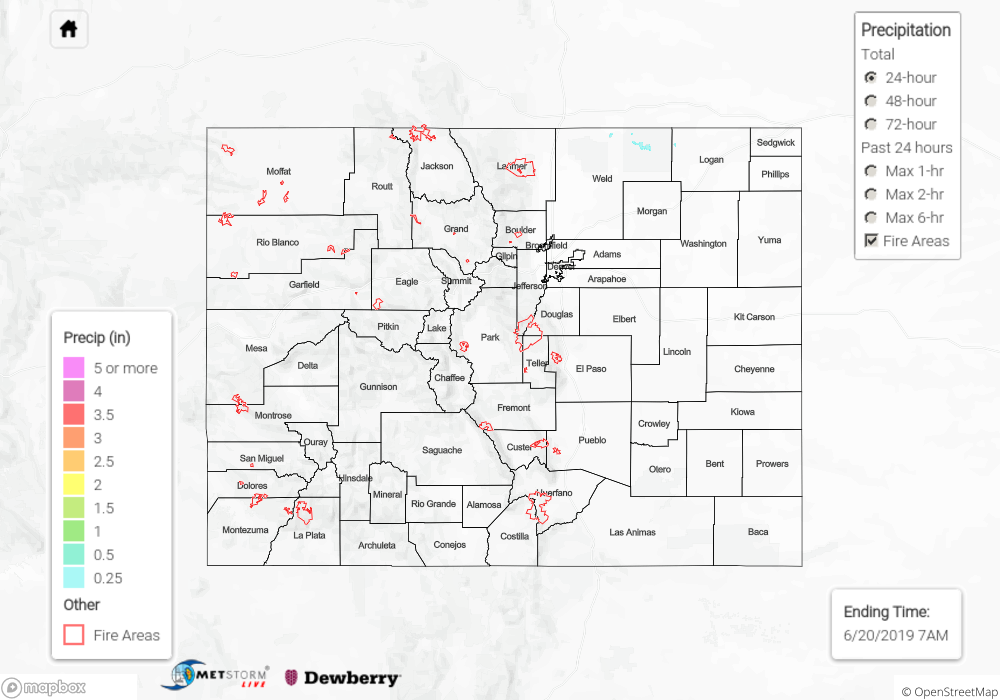
To see estimated precipitation totals over your area yesterday, scroll down to the State Precipitation Map below.
Click Here For Map Overview