Issue Date: Thursday, June 6th, 2019
Issue Time: 9:25AM MDT
Summary:
Increased moisture and dynamics over southern Colorado from the passing low brought cooler temperatures and plentiful rainfall to the area. For the most part, the rain was rather gradual and pulse-like in nature, so it didn’t cause too many problems with dew points remaining in the upper 40°Fs. The slow storm movement allowed for some brief, moderate rainfall to occur. Over Colorado Springs, totals up to 1 inch were estimated by radar with CoCoRaHS in the area reporting around 0.5-0.6 inches. Further south over the Raton Ridge, where better dynamics and moisture were present, totals up to 0.75 inches were recorded. The slow storm movement and moderate rainfall did pose a threat to burn areas – particularly the Spring Creek burn area. A Flash Flood was reported near County Road 442 around 2:45PM yesterday. Radar estimates up to 0.5 inches of rain fell over the area, but thankfully no major flood reports. Several areal flood advisories were issued as well along the Front Range and one over the Southeast Plains. However, there were no flooding reports in these areas as of this morning.
The Flood Warning was extended for the San Antonio and Conejos Rivers in southeastern Conejos County through Monday morning. Additional Areal Flood Advisories continued for the Gunnison River above Grand Junction, the La Plata River at Hesperus and for the Mancos River in Montezuma County for minor lowland flooding. These advisories continue until further notice by the NWS. Minor flooding was not reported at any of these locations, though rivers remain at or slightly above bankfull.
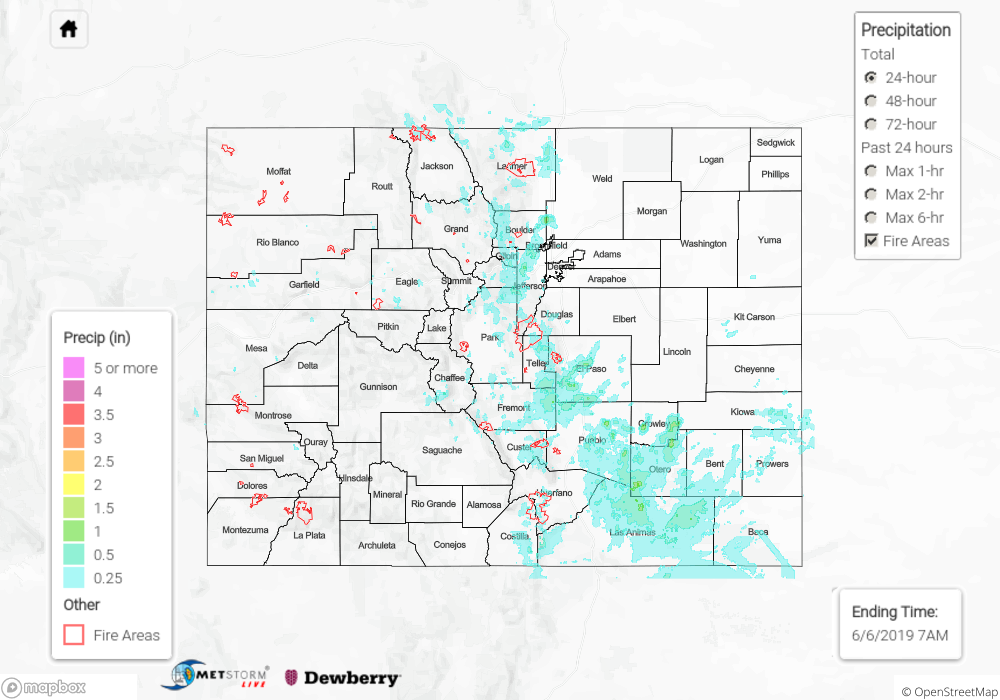
To see estimated precipitation totals over your area yesterday, scroll down to the State Precipitation Map below.
Click Here For Map Overview