Issue Date: Tuesday, June 4th, 2019
Issue Time: 9:10AM MDT
Summary:
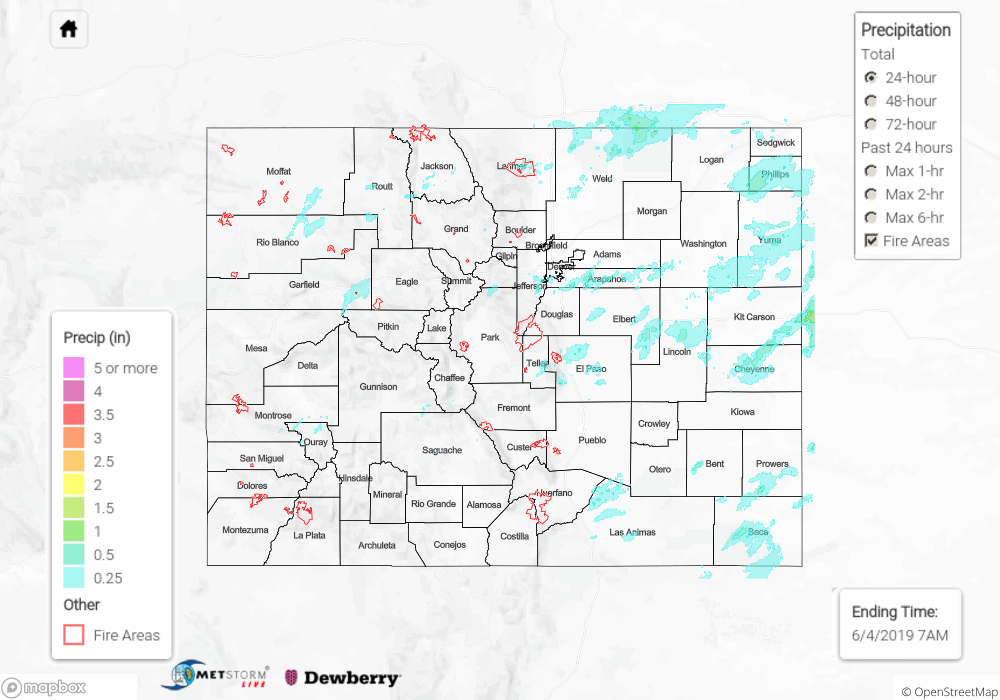
Another afternoon of thunderstorms fired over the high terrains and Palmer/Raton Ridges yesterday as a ridge built over the state. Low level moisture dropped off from Sunday, so the threat for heavy rainfall decreased. By early afternoon, some decent Severe Thunderstorms formed over the eastern plains. A landspout was reported in Logan County with another funnel reported in Cheyenne County. A gust of 68 mph was measured with the storm that produced the funnel. 24-hour totals were measured at 0.75 inches with max 1-hour rain rates up to 1.2 inches. Another thunderstorm formed over Colorado Springs and produced 1 inch hail. Maximum totals in the area were estimated at 0.5 inches. Over the mountains the stronger storms produced isolated rainfall totals of 0.5 inches favoring the Front Range for accumulation. Weak thunderstorms over Hotchkiss and Montrose, CO produce 0.25 inch hail and precipitation totals of 0.15 inches.
An Areal Flood Advisory was issued for the Mancos River in Montezuma County again for minor lowland flooding. A Flood Warning was issued for the San Antonio and Conejos Rivers in southeastern Conejos County through Thursday morning. The flow was reported as slightly above bankfull, so minor lowland flooding may have occurred though the gage has not reached above the Action stage yet. Flooding was not reported as of this morning from Monday.
To see estimated precipitation totals over your area yesterday, scroll down to the State Precipitation Map below.
Click Here For Map Overview