Issue Date: Monday, June 3rd, 2019
Issue Time: 9:10AM MDT
Summary:
Similar large-scale pattern for Sunday with a slight uptick in moisture. The upper level low continued to spin over southern CA/NV with a thermal ridge over the state. A weak shortwave helped spark more widespread rainfall and a couple severe thunderstorms over the eastern plains. Totals over the Southeast Plains were up to 2 inches with more general values in the 0.8 to 1.25 inch range. Hail in Elbert County was measured at 0.75 inches and a brief tornado associated with a gust front occurred near Burlington. Grand Junction and Gateway, Colorado also reported small hail with a thunderstorm in the area. Radar indicates just under 0.1 inches of rain falling with these storms.
Two areal flood advisories were issued for rising rivers. The first was for the Mancos River near Mancos in Montezuma County. The flow was slightly above bankfull, so minor lowland flooding may have occurred though the gage never reached above the Action stage. The second areal flood advisory was issued for the San Antonio and Conejos Rivers in southeastern Conejos County. Flooding was not reported as of this morning, but the advisory will likely be renewed throughout the week.
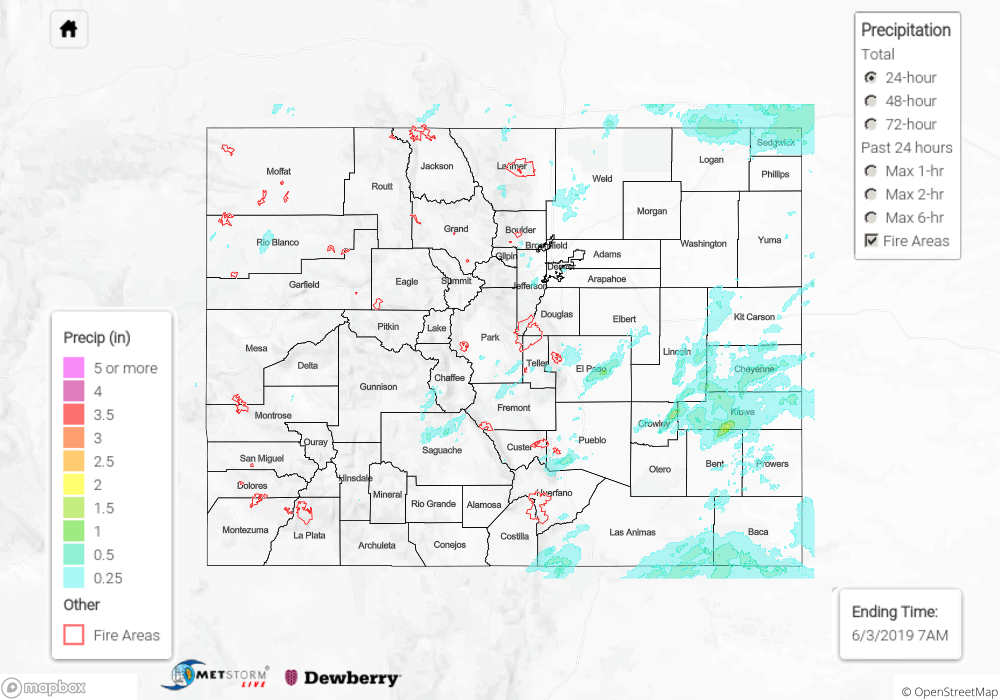
To see estimated precipitation totals over your area yesterday, scroll down to the State Precipitation Map below.
Click Here For Map Overview