Issue Date: Wednesday, May 29th, 2019
Issue Time: 9:05AM MDT
Summary:
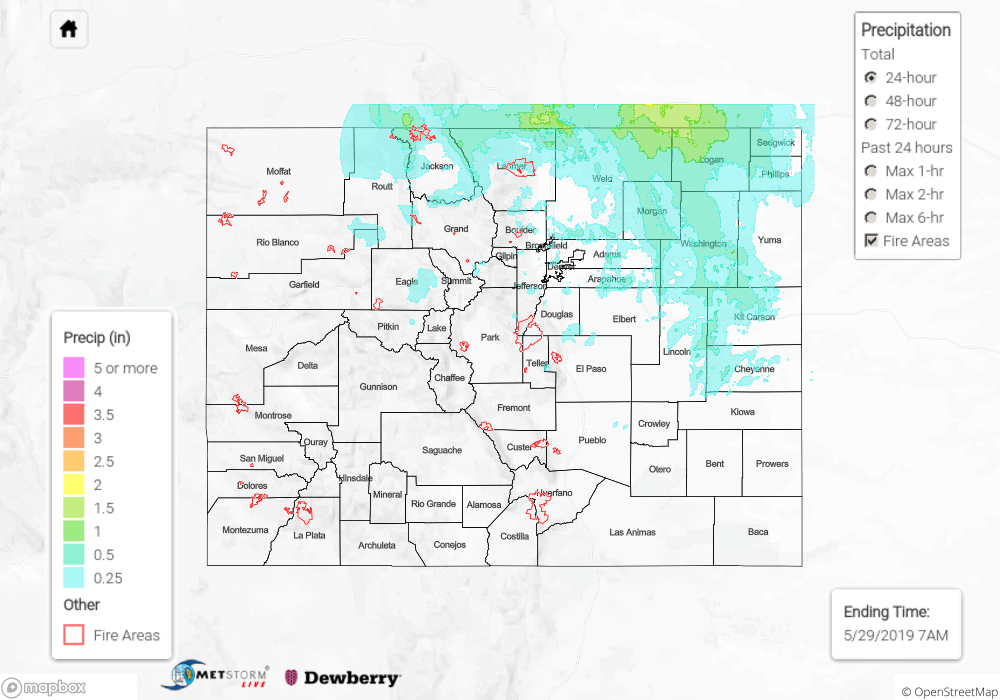
A cold front helped cool off high temperatures on Tuesday, so it was another day in May with below average temperatures. Further south, temperatures were a bit warmer until another blast of cold air moved in overnight. Yesterday, the upper level low moved across the state and brought widespread showers and snow (higher elevations) to northern Colorado. Downsloping winds to the south helped keep southeast Colorado rain free. Rainfall was more gradual in nature although some embedded convection and higher dew points to the east helped increase totals over the Northeast Plains. CoCoRaHS over the northeast corner of the state and over the Medicine Bow-Routt National Forest recorded around 1 inch for the 24-hour period. The only difference is the precipitation over the Northern Mountains fell as snow. The highest precipitation recorded at a SNOTEL site was 1.4 inches at Arapaho Ridge, which is located ~30 miles north of Kremmling. Over Ouray, 1.5 inches of snow fell. Half dollar sized hail was reported with a severe storm over Cheyenne County with radar indicating 0.5 inches of rain falling. Flooding was not reported on Tuesday.
To see estimated precipitation totals from Tuesday, scroll down to the State Precipitation Map below.
Click Here For Map Overview