Issue Date: Tuesday, May 28th, 2019
Issue Time: 9:50AM MDT
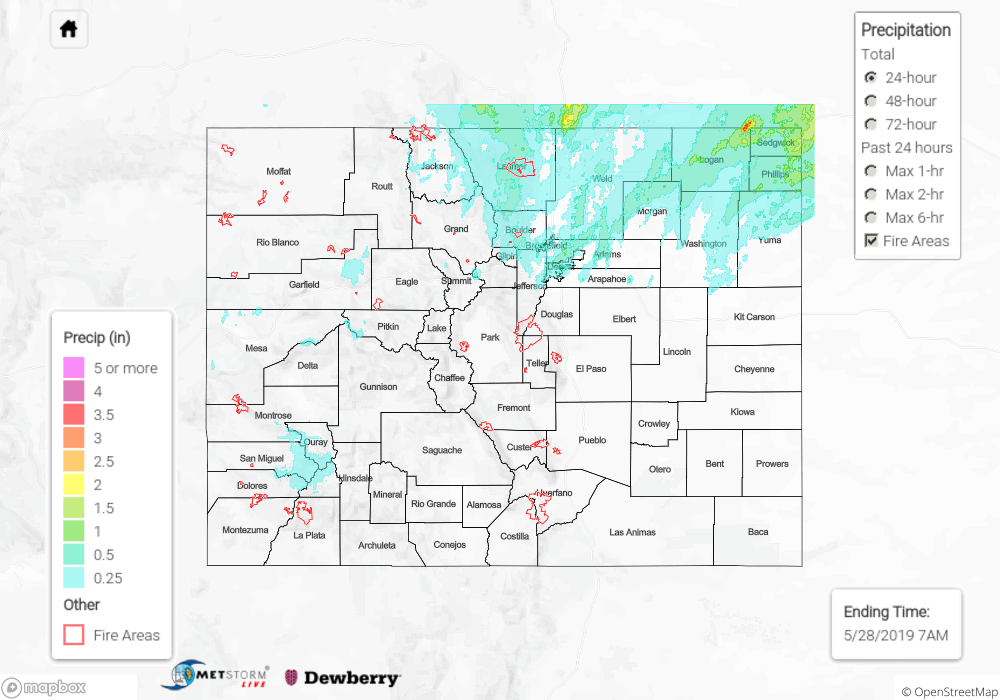
Summary:
Another wild weather day for eastern Colorado. Southwest flow in front of the low helped supply wind shear for a severe thunderstorm friendly environment over eastern Colorado. Large hail were reported with these storms as well as ample rainfall and tornadoes. There were 8 tornado reports with hail reports between 1 and 2 inches (further east in Yuma County). Two hour rainfall was measured between 2.5 and 3 inches over Logan County with 1-hr rain rates just over 1 inch. A Flash Flood warning was issued for Logan County at 6PM for areas west and north of Iliff. The highest CoCoRaHS for the day was in Julesburg where 2-2.5 inches were reported. As if all that wasn’t exciting enough, a late night hail storm moved through Denver (just after 1AM), which woke up the entire metro area. Hail size ranged from pea to quarter with this storm. Rainfall was estimated to be around 0.5 inches in the core of the storm.
To the west, more gradual rainfall was reported along with gusty winds (50-65 mph). Snow fell at the highest elevations with Silverton reporting 1.5 inches during the morning hours. Ouray reported 3.5 inches of snow for the day (not including what fell overnight). There was small quarter sized hail reported outside of Grand Junction with a storm that passed through in the late afternoon. Radar and CoCoRaHS in the area indicate between 0.1 and 0.2 inches of rain fell over this area.
To see estimated precipitation totals from Memorial Day, scroll down to the State Precipitation Map below.
Click Here For Map Overview