Issue Date: Monday, May 27th, 2019
Issue Time: 9:10 AM MDT
Summary:
Thanks to the combination of an influx of moisture from the east, plenty of daytime heating, and a disturbance aloft, yesterday was an active day of weather across Colorado. Over much of the High Country where moisture was limited, scattered showers and a couple weak thunderstorms was all Mother Nature could muster, producing mainly light rain and gusty winds. The Front Range was the exception to this rule, thanks to moisture from the east being transported into the terrain, so there was a bit more wetting rainfall over that region.
The main weather impacts yesterday were east of the mountains, where good moisture was transported into the state from the Great Plains. This moisture was more than enough fuel for the production of scattered showers and thunderstorms, many of which were strong/severe. The bulk of the activity occurred from Noon – 10 PM, but a few showers/storms lingered into the early morning hours over the Northeast Plains. Check out the some of the more severe storm reports submitted to the National Weather Service:
3.00 inch hail: 3 miles W of New Raymer (Weld County)
2.50 inch hail: 2 miles NNE of New Raymer (Weld County), Springfield (Baca County)
2.00 inch hail: 4 miles S of Eads (Kiowa County)
1.75 inch hail: 4 miles NNE of Sweetwater Reservoir (Kiowa County)
1.50 inch hail: 5 miles SSE of Milton Reservoir (Weld County), 3 miles NNE of Sweetwater Reservoir (Kiowa County), 2 miles WNW of Vilas (Baca County)
Tornado: 10 reports total submitted from the following counties: Prowers, Bent, Kiowa, Weld, Adams, and Lincoln
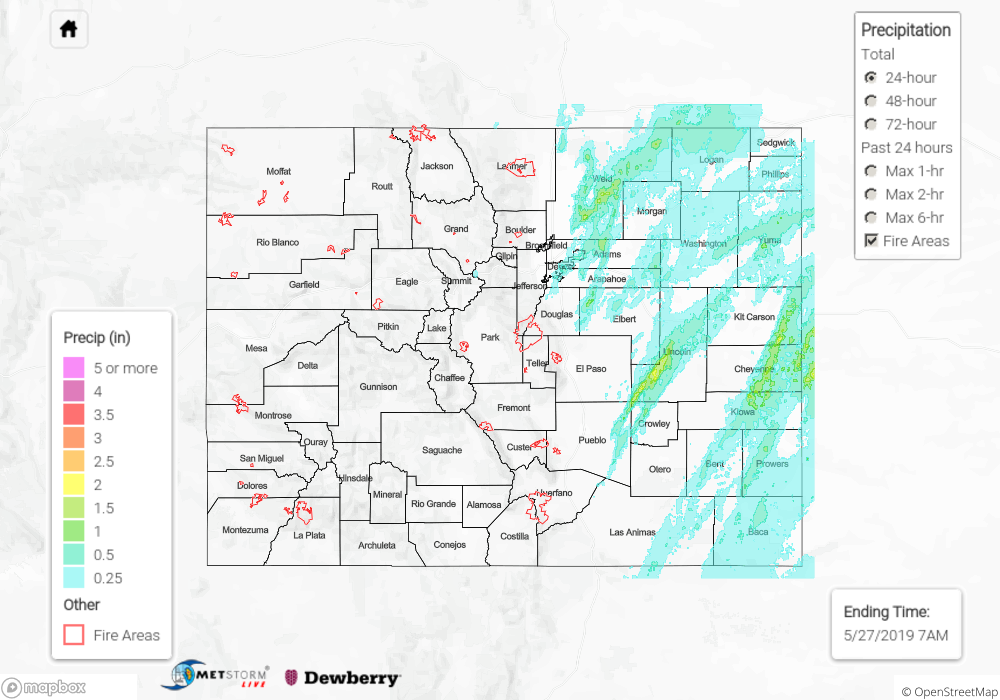
Street flooding was reported in Springfield, up to six inches deep, around 1 PM. For a look at precipitation estimates in your area, please see the State Precipitation Map below.
Click Here For Map Overview
The map below shows radar-estimated, rainfall gage-adjusted Quantitative Precipitation Estimates (QPE) across Colorado. The map is updated daily during the operational season (May 1 – Sep 30) by 11AM. The following six layers are currently available: 24-hour, 48-hour and 72-hour total precipitation, as well as maximum 1-hour, 2-hour and 6-hour precipitation over the past 24 hour period (to estimate where flash flooding may have occurred). The 24-hour, 48-hour and 72-hour total precipitation contain bias corrections that are not disaggregated into the hourly estimates, so there will likely be some differences. The accumulation ending time is 7AM of the date shown in the bottom right corner. Also shown optionally are vulnerable fire burn areas (post 2012), which are updated throughout the season to include new, vulnerable burn areas. The home button in the top left corner resets the map to the original zoom.