Issue Date: Tuesday, May 21st, 2019
Issue Time: 9:20AM MDT
Summary:
A very strong trough and low moved into southeast Colorado yesterday. Temperatures dropped off significantly with this storm, so winter wasn’t quite over yet. Snow was being reported in Parker during the late morning. With the changeover occurring so early, higher 24-hour accumulations were expected over the Palmer Ridge. The changeover occurred by early evening over the Urban Corridor, so everyone woke up to some snow this morning. To see snow totals from yesterday, check out a map here: Snow Totals for 5/20-5/21/2019.
A few stronger storms were able to form over the Southeast Plains where more favorable dynamics were present by early morning. However, they remained below severe threat criteria with only small hail reports. A gust of 59 mph was recorded at La Junta Airport with radar indicating up to 4 inches of rain falling in the area. Max 1-hr rain rates remained below 1.5 inches over lush vegetation, so flooding was not an issue. The highest 24-hour totals were along a north-south line from central Adams County to Pueblo County. There was also heavy snowfall over the mountains with the highway being shut down for bit near the tunnel. Over western Colorado, totals were estimated up to 1 inch over the mountains, which fell as snow. There was a brief funnel reported near Glad Park in Mesa County associated with a storm in the area, which goes to show how mountains produce their own unique circulations.
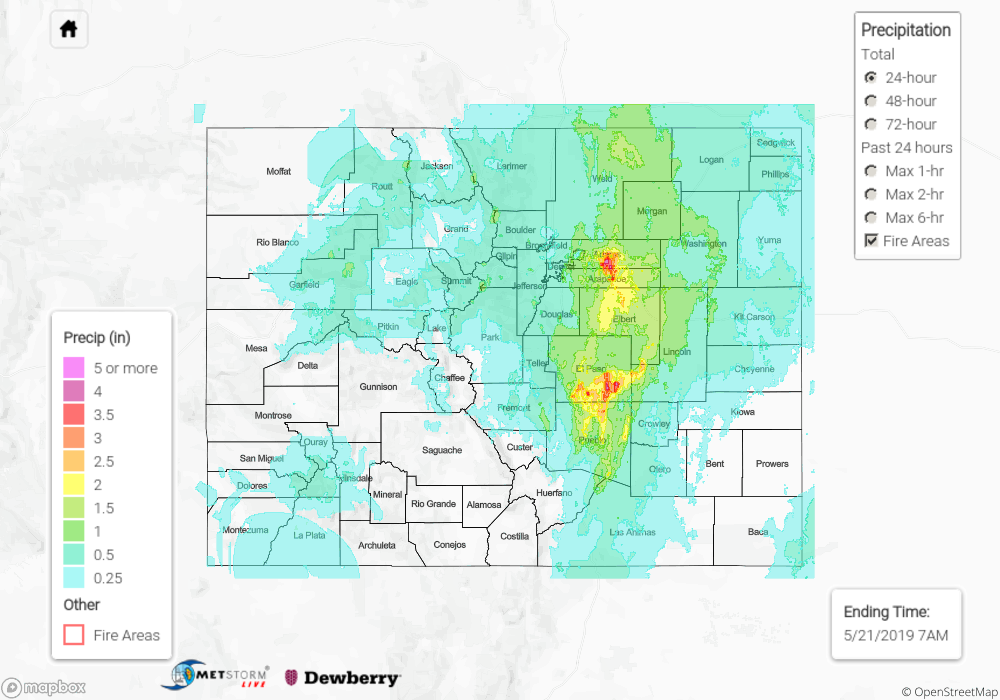
To see precipitation totals from Monday over your area, scroll down to the State Precipitation Map below.
Click Here For Map Overview