Issue Date: Saturday, May 18th, 2019
Issue Time: 9:10 AM MDT
Summary:
An upper-level trough that was centered over the Great Basin on Thursday pushed eastward and moved overtop of Colorado yesterday and provided large-scale lift for the development of showers and thunderstorms. Most of the activity occurred over the High Country and Northeast Colorado, while the Southeast Plains were more-or-less shut out thanks to a lack of surface moisture (dewpoints were in the 20s and 30s). The strongest storms of the day occurred over the Urban Corridor and Northeast Plains north of I-70, producing hail, strong winds (one severe gust of 66 mph reported in Briggsdale), and periods of moderate rainfall. The following severe hail reports were submitted to the National Weather Service:
2.75 inch hail: Sedgwick (Sedgwick County)
2.50 inch hail: 4 miles E of Merino (Logan County)
2.00 inch hail: Sedgwick (Sedgwick County)
1.75 inch hail: Crook (Logan County), Sterling (Logan County)
1.50 inch hail: 1 mile ENE of Sterling (Logan County), Sedgwick (Sedgwick County)
1.25 inch hail: 8 miles W of Greeley (Weld County)
1.00 inch hail: Frederick (Weld County), 12 miles NNE Pawnee Buttes (Weld County), 2 miles N of Dailey (Logan County), 9 miles NW of New Raymer (Weld County), 9 miles SW of Westplains (Weld County)
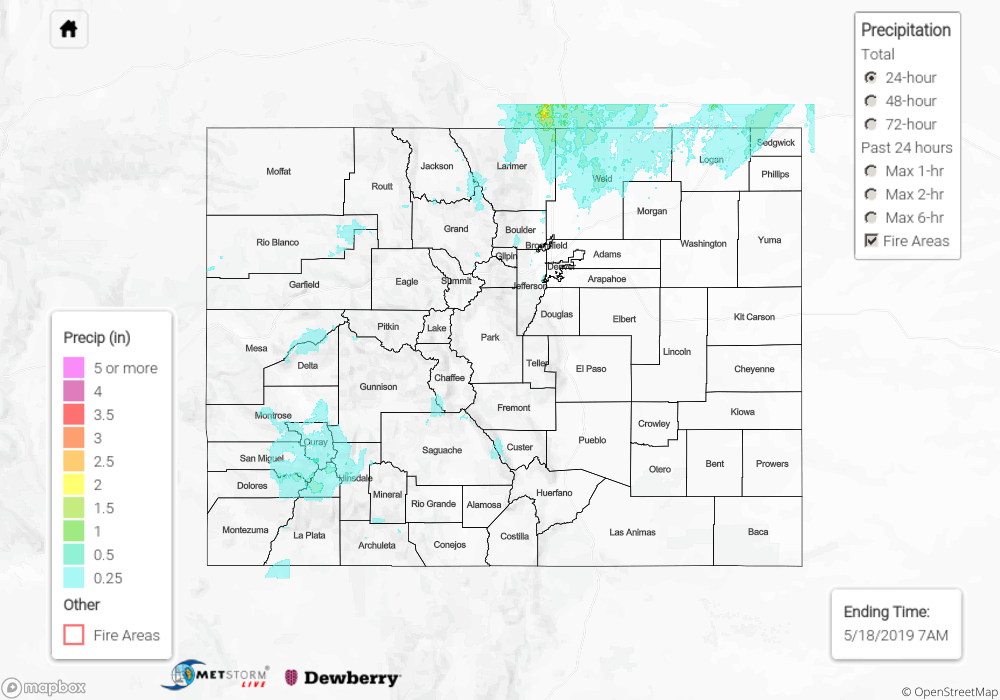
No flash flooding was reported yesterday. For a look at precipitation estimates in your area, please see the State Precipitation Map below.
Click Here For Map Overview
The map below shows radar-estimated, rainfall gage-adjusted Quantitative Precipitation Estimates (QPE) across Colorado. The map is updated daily during the operational season (May 1 – Sep 30) by 11AM. The following six layers are currently available: 24-hour, 48-hour and 72-hour total precipitation, as well as maximum 1-hour, 2-hour and 6-hour precipitation over the past 24 hour period (to estimate where flash flooding may have occurred). The 24-hour, 48-hour and 72-hour total precipitation contain bias corrections that are not disaggregated into the hourly estimates, so there will likely be some differences. The accumulation ending time is 7AM of the date shown in the bottom right corner. Also shown optionally are vulnerable fire burn areas (post 2012), which are updated throughout the season to include new, vulnerable burn areas. The home button in the top left corner resets the map to the original zoom.