Issue Date: Wednesday, May 8th, 2019
Issue Time: 9:40AM MDT
Summary:
The low begin to move eastward and stayed just south of Colorado yesterday. This provided lift for some widespread shower activity and a cloudy/foggy start to the morning. Dense fog was present throughout the day near the Colorado and Kansas border. By the time the lift had moved over the Front Range, not quite enough daytime heating had occurred due to the heavy cloud cover in the morning, so multiple rounds of showers kept instability low and prevented organized storms along the Urban Corridor. Decent accumulations and beneficial rainfall occurred with radar indicating widespread values of 0.4 to 0.5 inches and up to 1 inch in southern Weld County. Another wave moved through southeastern Colorado, which triggered storms along the Southeast Mountains and Raton Ridge. Max 1-hr rain rates up to 0.5 inches were realized with a 24-hr total of 0.7 inches reported by a CoCoRaHS station in Baca County. Lastly, some late night convection occurred over the northeast corner of the state. CoCoRaHS in the area indicate this produced as much as 1.3 inches in Phillips County. No severe storms or flooding were reported yesterday.
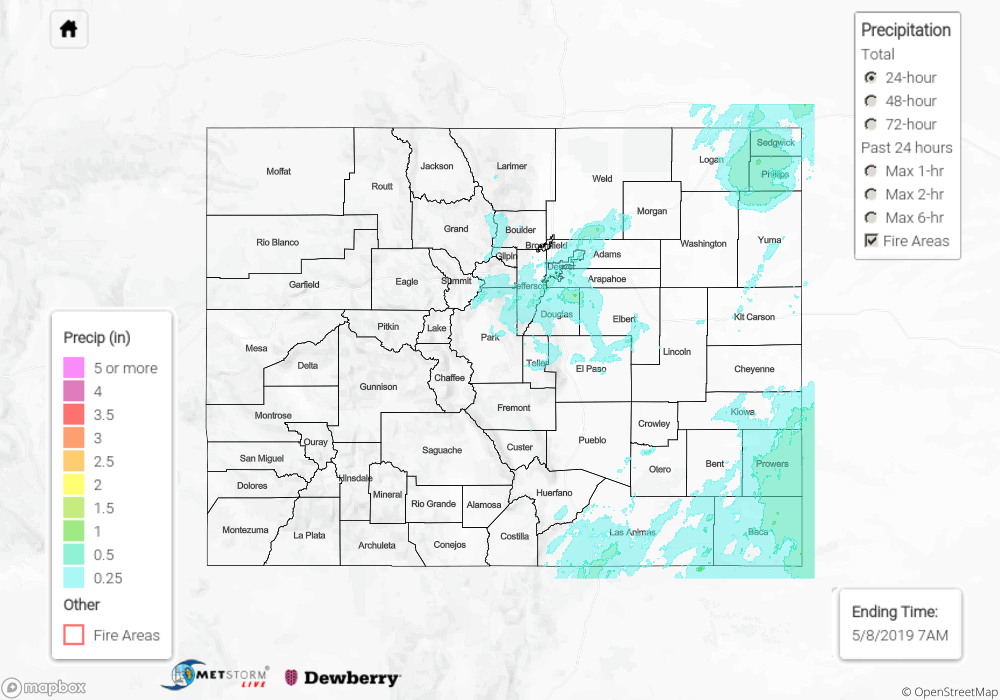
To see precipitation totals over in your neighborhood on Tuesday, scroll down to the State Precipitation Map below. Note the 2.5 inches near Parker is an error. Totals in this area were between 0.4 and 0.5 inches (ALERT).
Click Here For Map Overview