Issue Date: Tuesday, May 7th, 2019
Issue Time: 10:40AM MDT
Summary:
Some low clouds and fog to start the day over eastern Colorado with moisture return behind a cold front. The California low started to move inland yesterday, which brought some upper level support for afternoon storms. Mid and upper level energy and the return of low level moisture helped increase showers and thunderstorms over the northern high terrains yesterday afternoon. As storms moved into the adjacent plains during the afternoon hours, they did not produce much (if any) rainfall until they reached they reached the plains. A handful of Severe Thunderstorm Warnings were issued with the main action over the Southeast Plains and Palmer Divide. Half dollar sized hail (1.25 inch) was reported near Limon and a 68 mph gust was recorded near Springfield. The highest 24-hr storm totals were over Elbert County were 1.5 inches fell and Baca County where 2 inches were reported over the far southeast corner. Dense fog began in the evening and has continued through this morning.
With continuous upslope flow and a moist, decently unstable environment, another set of storms moved off of the mountains during the early evening hours and rolled into the Urban Corridor. These storms brought rainfall totals for the 24-hr period anywhere between 0.05 and 0.75 inches. Copious pea sized hail was also reported in North Denver. Light showers continued through this morning against the foothills with dense fog being reported over the mountains and eastern half of the state. Flooding was not reported yesterday.
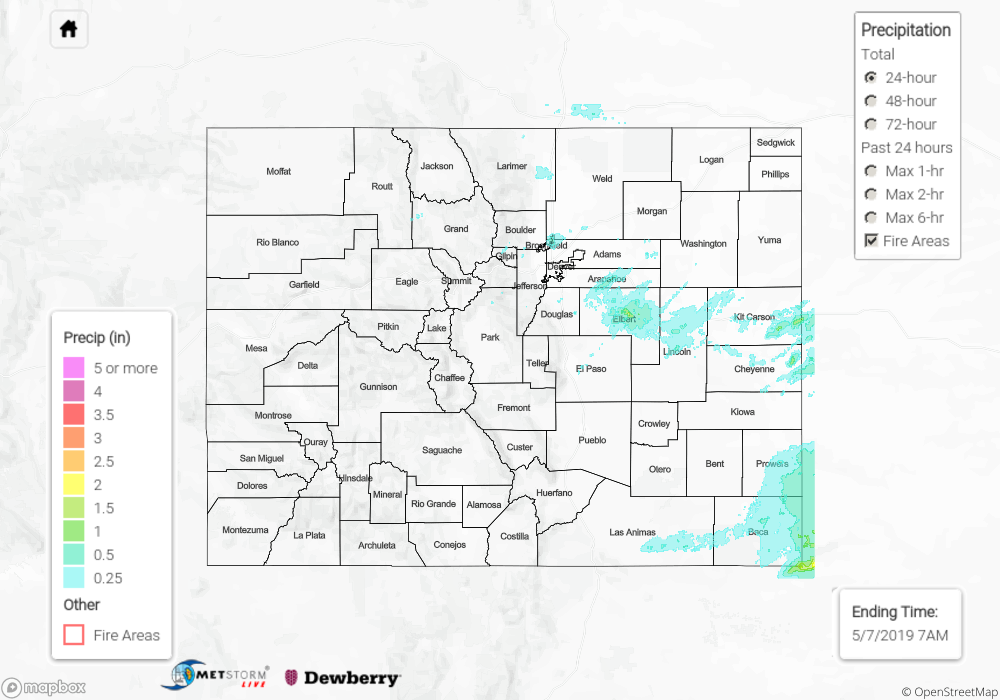
To see precipitation totals over in your area, scroll down to the State Precipitation Map below.
Click Here For Map Overview