Issue Date: Tuesday, August 7th, 2018
Issue Time: 10:00 AM MDT
Summary:
Yesterday was quite an active day with severe thunderstorm activity over eastern Colorado. By early afternoon, storms began to fire over the high terrains. High low-level moisture helped create very efficient rain totals despite fast storm motion. Outflow boundaries from the storms also helped spark multiple rounds of showers and thunderstorms over one area. Widespread flooding was avoided, but the thunderstorms still produced a lot of damage. High instability, favorable shear parameters and extra lift from a passing shortwave helped produce some very severe thunderstorms over Colorado Springs. Hail up to 3 inches in diameter was reported (baseball), which caused devastating damage and sent several people to the hospital. Reports of car and home windows being blown out were commonplace during the evening. Fountain Creek, known for flash flooding, rose over 4 feet, but thankfully, not out of its banks. It should be able to recover before the next round of thunderstorms this afternoon.
There were several flood warnings and advisories yesterday accompanying the severe thunderstorms. Max 1-hour rain rates were estimated up to 1.5 inches with storm totals over 3 inches due to multiple rounds of rainfall. CoCoRaHS and USGS precipitation gages in Colorado Springs reported storm totals just over 1.5 inches with the highest report being 1.94 inches. At Beulah Valley (Junkins burn scar area), a CoCoRaHS recorded 0.84 inches. Over Las Animas County (Delhi area), a 24-hour, heavy rainfall report of 3.63 inches came in this morning. Severe thunderstorms also moved into Weld and Morgan County that formed over the Cheyenne Ridge. Max 1-hour rain rates were estimated just over 1.5 inches. Despite the heavy rainfall totals recorded yesterday with the fast moving storms, no flooding was not reported as of 10AM on Tuesday morning.
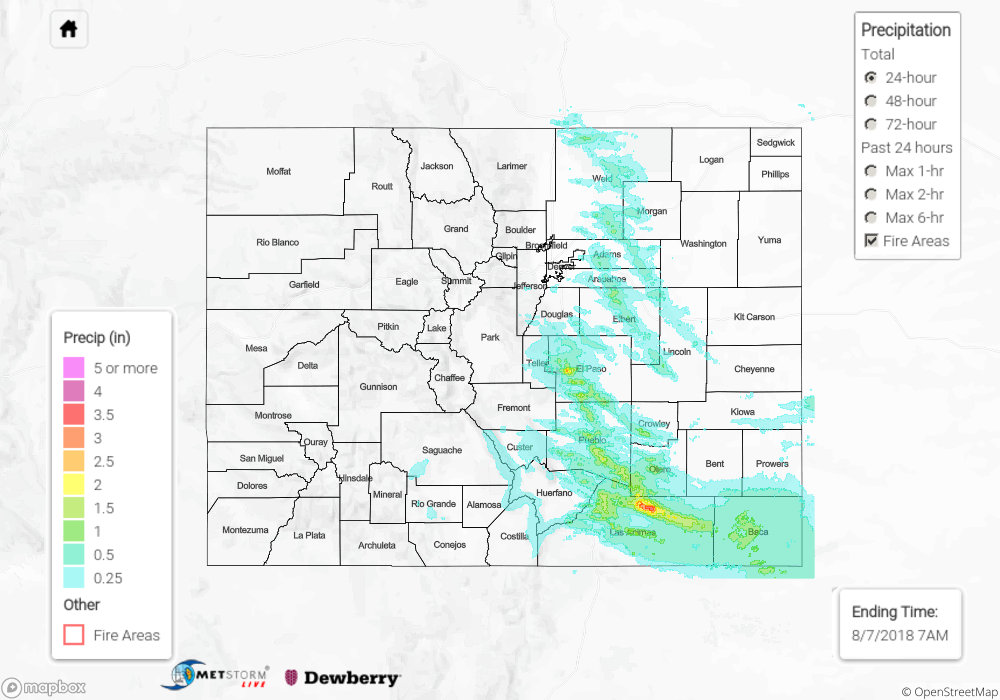
To see how much precipitation in your area, scroll down to the State Precipitation Map below.
Click Here For Map Overview