Issue Date: Monday, August 6th, 2018
Issue Time: 09:50 AM MDT
Summary:
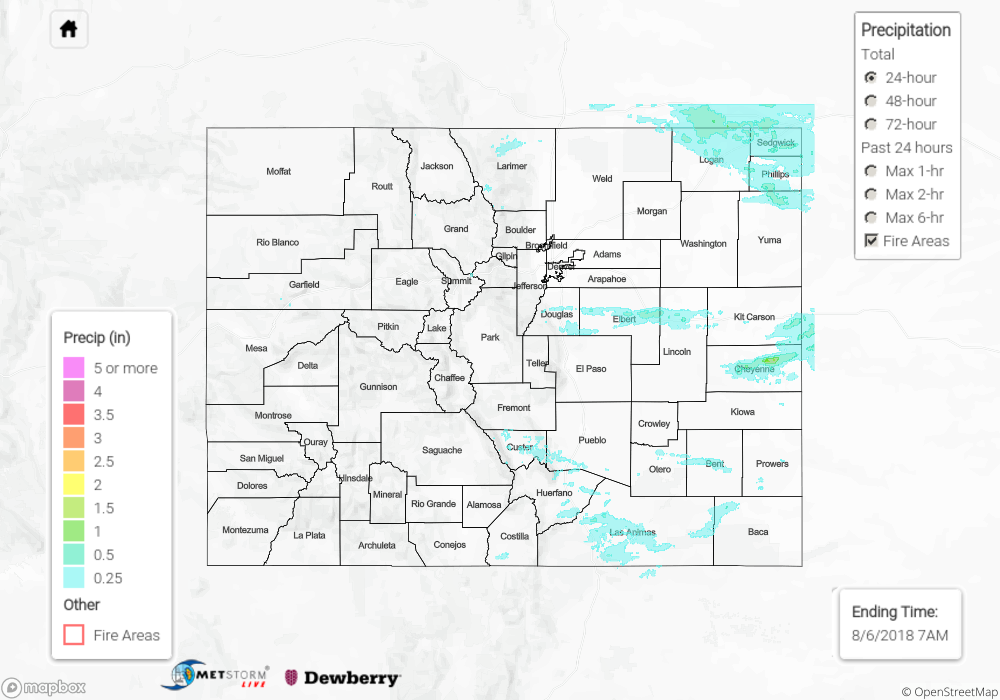
A couple rounds of garden variety of storms moved through the state on Sunday. The day began with some light and moderate showers over the eastern plains. These storms moved eastward and exited the state by early afternoon. At this time, storms begin to fire under the upslope flow regime over the high terrains with the main activity occurring over the Southeast Mountains/Raton Ridge and Palmer Ridge. To the west over Custer County in the Southeast Mountains, there was a storm report for 0.75 inch hail with rainfall rates estimated just over 0.25/hour. Over the adjacent plains, 24-hour totals were just over 0.5 inches.
The more severe storms formed north of Colorado over the Cheyenne Ridge. As they moved east, the dipped a bit south over the far northeast corner of the state. Daytime clearing allowed the atmosphere to recover from the showers earlier in the morning. Logan County had a severe thunderstorm that produced large hail (2.75 inches) and strong winds (70 mph). Rainfall totals were estimated from radar around 0.75 inches. Further south over Cheyenne County, an evening thunderstorm produced 1.5 inches/hour with a CoCoRaHS in the area reporting 0.9 inches. No flooding was reported on Sunday.
To see how much precipitation over your neighborhood, scroll down to the State Precipitation Map below.
Click Here For Map Overview