Issue Date: Sunday, August 5th, 2018
Issue Time: 9:30 AM MDT
Summary:
A plume of moisture transported by the building upper-level ridge fueled scattered showers/thunderstorms across Colorado yesterday, mainly during the afternoon and evening hours. Most of the activity was garden variety, producing light rainfall and gusty winds, while a couple of stronger storms produced periods of moderate rainfall and strong winds. Due to the decent wind speeds aloft, showers/storms moved at a good clip towards the east, and it was a good day of wetting rains with no flash flooding concerns. Overnight, a secondary disturbance aloft moved across the region, kicking off another round of scattered showers/weak thunderstorms, mainly along and north of I-70. As far as storm reports are concerned, the following are the thunderstorm observations of note submitted to the National Weather Service:
60 mph (estimated) thunderstorm wind gust: 1 mile W of Firestone (Weld County)
59 mph thunderstorm wind gust: 1 mile N of Buckley AFB (Arapahoe County)
58 mph thunderstorm wind gust: 2 miles E of Loveland (Larimer County)
54 mph thunderstorm wind gust: 5 miles NW of Mack (Mesa County)
0.7 inches of heavy rainfall: 6 miles ESE of Oak Creek (Routt County)
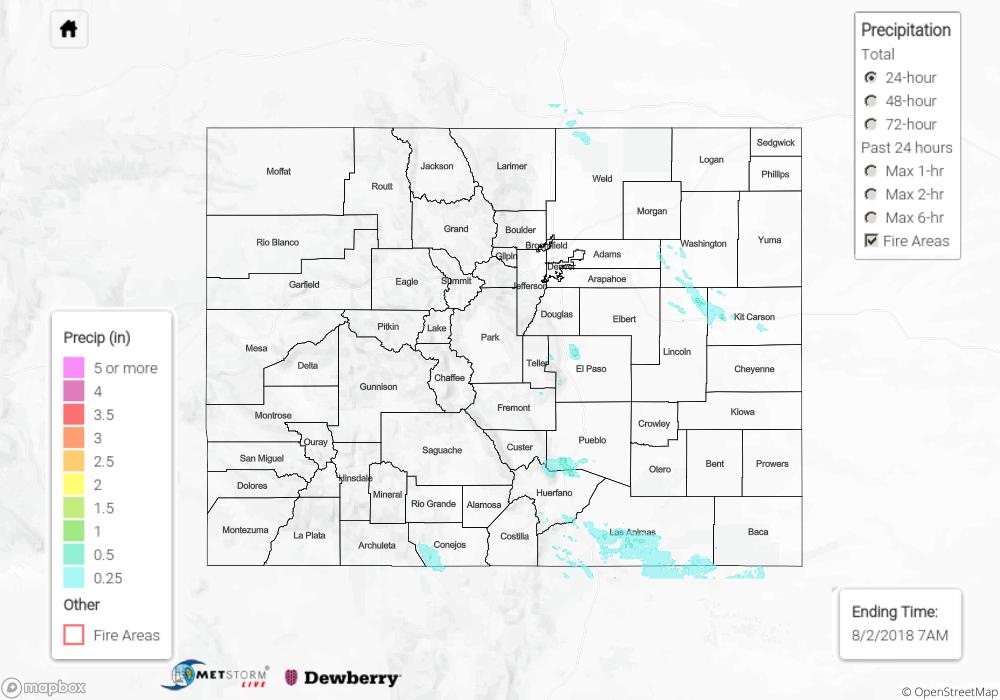
For a look at precipitation estimates in your area, please see our State Precipitation Map below.
Click Here For Map Overview
The map below shows radar-estimated, rainfall gage-adjusted Quantitative Precipitation Estimates (QPE) across Colorado. The map is updated daily during the operational season (May 1 – Sep 30) by 11AM. The following six layers are currently available: 24-hour, 48-hour and 72-hour total precipitation, as well as maximum 1-hour, 2-hour and 6-hour precipitation over the past 24 hour period (to estimate where flash flooding may have occurred). The 24-hour, 48-hour and 72-hour total precipitation contain bias corrections that are not disaggregated into the hourly estimates, so there will likely be some differences. The accumulation ending time is 7AM of the date shown in the bottom right corner. Also shown optionally are fire burn areas (post 2012), which are updated throughout the season to include new burn areas. The home button in the top left corner resets the map to the original zoom.