Issue Date: Wednesday, August 16, 2017
Issue Time: 09:55AM MDT
Summary
Above normal low-level moisture continued to hold on over the northeast plains yesterday. A large-scale trough was positioned over the west coast that helped support a surface low pressure system over Colorado. The low pressure helped pull in moist air on its eastern side for a couple rounds of showers and thunderstorms yesterday, but the heaviest precipitation remained just east over Nebraska. A cold front moved through the area last night, and the upper-level trough continues to move through the state this morning. This trough is supporting light showers over the eastern plains.
With favorable dynamic forcing, many of the storms of the plains yesterday became severe and produced gusty winds with hail up to 2 inches in diameter. There were also two Flash Flood Warnings for thunderstorms over Lincoln and Kit Carson County and a few other Areal Flood Advisories for the thunderstorms due slower storm motion. Storm totals over Lincoln County were as high as 3 inches with 1-hour rain rates up to 2.5 inches proving storms yesterday to be efficient precipitation producers. A report just outside of Hugo stated that there was 3 feet of standing water in a field and water over roadways. In Weld County, just over 4 inches were estimated by radar with 1 hour rain rates up to 3.5 inches. There were no gages in the area to confirm totals and most of the heavy precipitation fell in ungaged areas. The highest CoCoRaHS observation over Sedgwick County where 1.22 inches was recorded for the 24-hour period. Over the mountains, the scattered storms favored the northern portion of the state. Due to the lower moisture environment, heavy rainfall was not forecasted. The largest 24-hour total was recorded over Larimer (0.63 inches), but all other reports were under 0.5 inches.
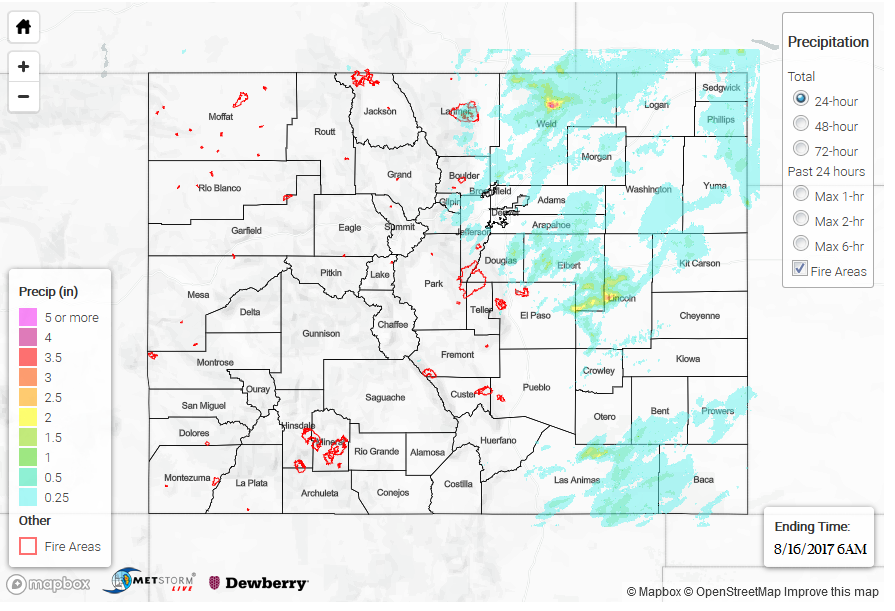
To see how much rain fell over your area, check out the State Precipitation Map below.
Click Here For Map Overview
Note: We have identified a possible underestimation in QPE over the southwest part of the state. We are working to on this issue, and will provide an update as soon as possible.