Issue Date: Monday, August 14, 2017
Issue Time: 09:50AM MDT
Summary
A lee trough set up yesterday that helped pull in moisture on its east side and brought drier conditions to its west. Dew points over Denver yesterday afternoon were around 40F, while on the far eastern plains, dew points were in the mid-60s. These lower moisture areas produced more gusty winds with storms that came through than heavy rainfall. Storms began firing over the mountains around 1PM as well as over the Southeast Plains along a surface boundary. Eventually the storms over the Northeast Plains merged and moved S/SE through the evening hours and exited over the Kansas border around 1AM. Showers over the mountains quickly ended after sundown.
A severe thunderstorm watch was issued for the eastern plains due to increased moisture, shear and a good amount of instability. Thunderstorms that made it into the far eastern plains, quickly became severe. Over Prowers County, hail up to 2.75 inches was recorded. These storms also had strong winds. Over Burlington, a 66 mph gust was recorded at a weather station. Storm totals in the area were estimated at 1.6 inches with 1-hour rain rates around the same amount. Two flood advisories were issued yesterday for Rio Blanco and Garfield County. Precipitation totals in the area were estimated at 1.4 inches. As of this morning, there were no flood reports. The gage at La Junta along the Arkansas River continues to run at Action Stage this morning, but flow is forecasted to decrease throughout the day.
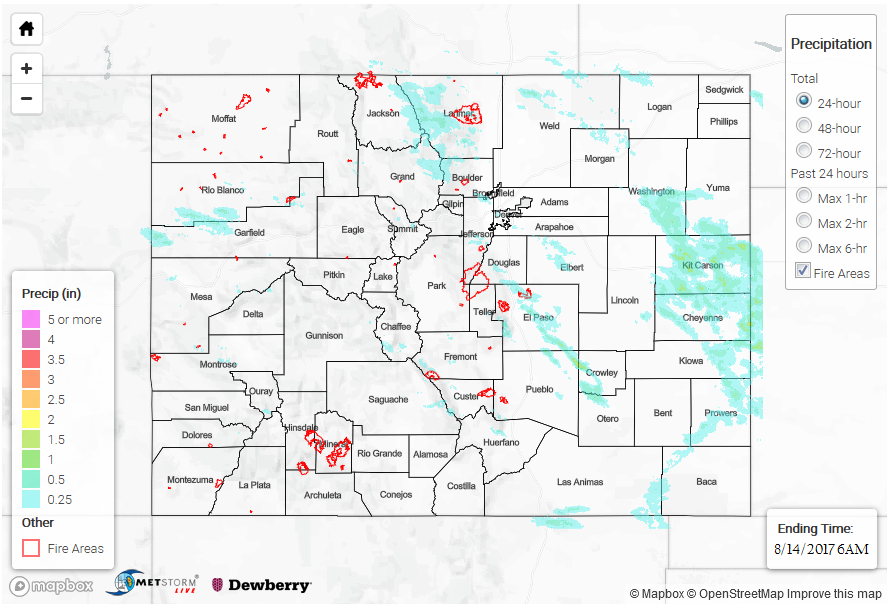
To see how much rain fell in your neighborhood, check out the State Precipitation Map below.
Click Here For Map Overview
Note: We have identified a possible underestimation in QPE over the southwest part of the state. We are working to on this issue, and will provide an update as soon as possible.