Issue Date: 5/25/2015
Issue Time: 12:00PM
Valid period: May 26th through June 9

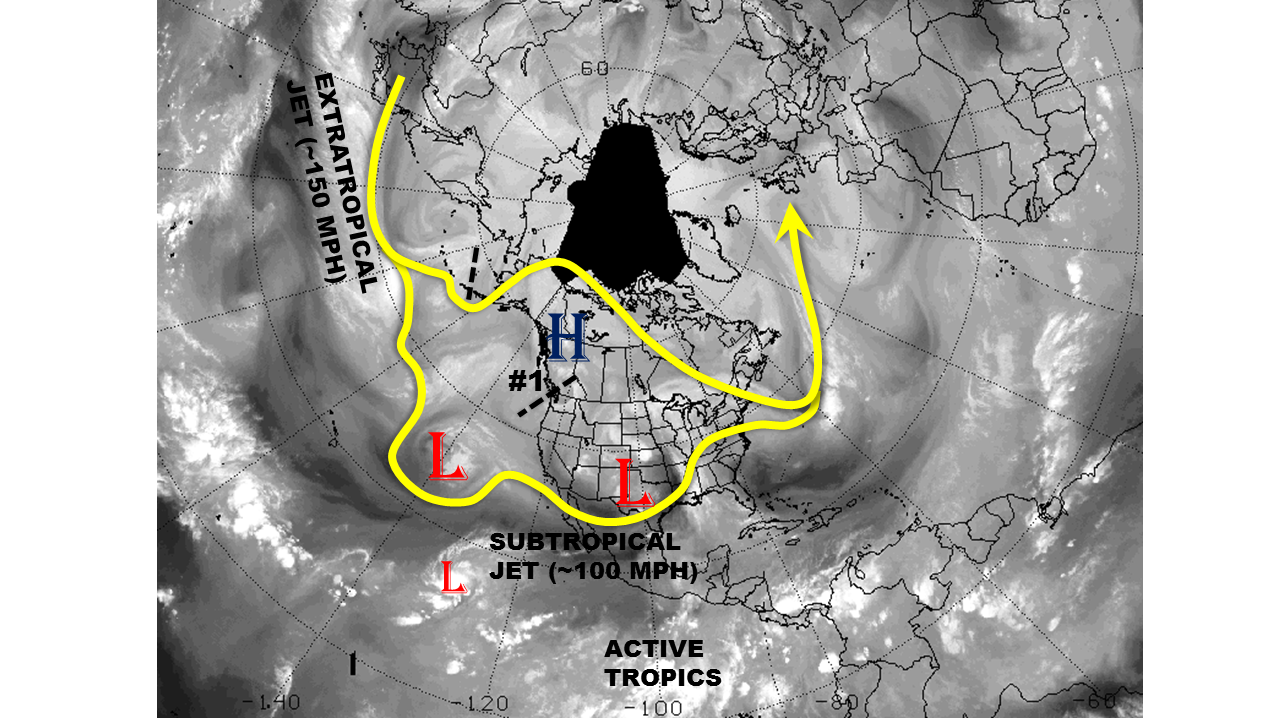
The prolonged stretch of very active weather characterized by cloudy, cool, rainy and snowy conditions appears to be winding down. The water vapor image below shows this morning’s snapshot of the Northern Hemisphere circulation. Much like the past two to three weeks, the overall pattern consisted of a strong extratropical jet over the west Pacific Ocean. The flow associated with the jet then splits into two flows midway across the ocean, resulting in a strong high pressure ridge over western Canada and the famous “cut-off” lows off the California coast and the southwest U.S. It is of course the latter that has been the culprit of consistent wet days across Colorado.
In the near-term, the major change to the above pattern will be two fold. First, a general slow-down in the progression of features. Second, the gradual development of a high-pressure ridge across the southwest U.S resulting in much warmer temperatures over Colorado by next week.
Over the next two weeks, we have identified three events that may impact the flood threat. Only the first event has an Elevated flood threat. The second event is tied to the forecasted snow-melt from much warmer temperatures. The third event is a combination of warmer temperatures plus the potential of tropical moisture impacting the western part of the state. Below is a more detailed description of each event.
NOTE: After we describe the three events below, we provide an El Nino update to get a glimpse at the longer-range summer forecast. In short, think “wet”, but please be sure to check out the full discussion.
The three events that we have identified are:
- Event #1: Friday (5/29) through Saturday (5/30)
- An Elevated flood threat east of the Divide
- Event #2: The following Wednesday (6/3) through Saturday (6/6)
- Much warmer temperature will result in elevated streamflows over large snowpack areas of the higher terrain. No flood threat is anticipated at this time, but this will be a key feature to watch.
- Event #3: Next week’s Saturday (6/6) through Sunday (6/7)
- A tropical system is expected to come up the Central American coast and possibly bring moisture west of the Divide. No flood threat is currently anticipated, but the tropical feature will need to be closely monitored.
EVENT 1: Friday (5/29) through Saturday (5/30)
An Elevated flood threat for most of eastern Colorado
A stationary front is expected to move across eastern Colorado later this week. This will combine with an upper-level disturbance that is currently positioned over the northwest U.S. coast (see water vapor image above) to result in heavy rainfall. The best estimate of the highest rainfall totals, in the 1.5 to 2.0 inch range, is expected in east-central Colorado, but this will be substantially refined in the next Flood Threat Outlook.
EVENT 2: Wednesday (6/3) through Saturday (6/6)
No flood threat is anticipated at this time
The development and intensification of the southwest U.S. high-pressure ridge will result in much warmer temperature by next week. High temperatures may reach the mid-80s to mid-90s in the lowest elevations with 50s and 60s in the highest elevations. Given the recent amount of heavy, wet snowfall across the higher terrain, this will cause significant snow melt. While no flood threat is currently apparent, individual basins will be monitored to assess the amount of snowpack remaining along with forecasted temperatures.
EVENT 3: Saturday (6/6) through Sunday (6/7)
No flood threat is anticipated at this time
A tropical disturbance is forecasted to develop and progress up the Central American coast through the Baja of California by the middle of next week. Once it reaches the Baja, it is unclear if the disturbance will disintegrate and release substantial moisture into the southwest U.S. or continue off to the west and keep the moisture for itself. The former will result in a flood threat west of the Divide, while the latter will not impact the Colorado much. The next two Flood Threat Outlooks should have a much better grasp of this feature.
EL NINO UPDATE
As a final note in today’s Flood Threat Outlook, we present a brief overview of what the ongoing El Nino may bring for Colorado. There is mounting evidence that the current weak El Nino will continue and likely intensify as we head into summer. So what does that imply for Colorado precipitation?
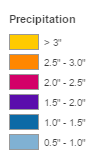
The first map shows the current Sea Surface Temperature anomalies (source: NOAA). Note the warm patch of ocean over the equator in the Pacific Ocean; these conditions are referred to as El Nino. These surface anomalies, up to 3 degrees Celsius are also accompanied by sub-surface anomalies of up to 5 degrees Celsius implying a very deep “bank” of warm ocean water to draw from.
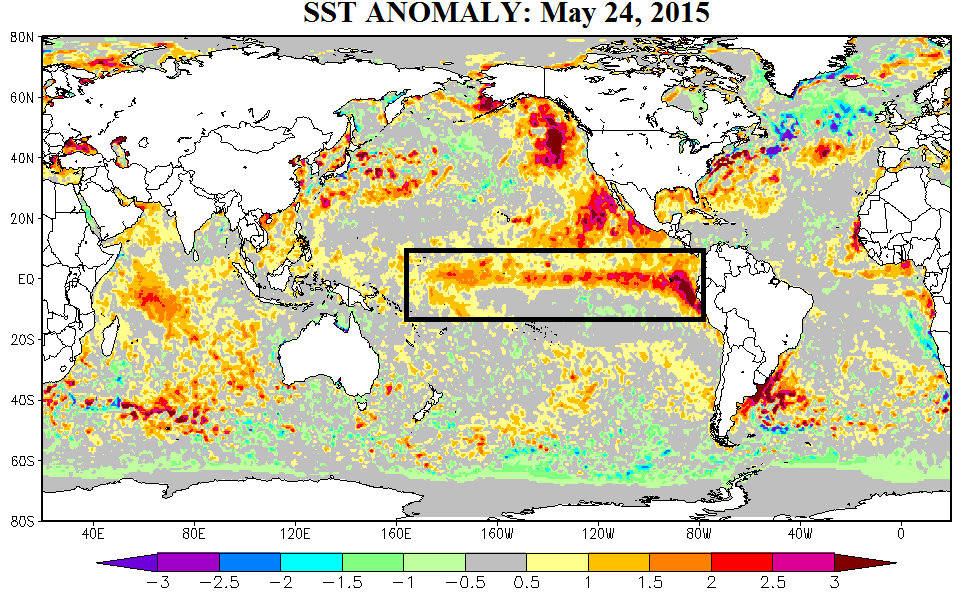 One interesting question to pose is: historically, how do warm temperatures in the region outlined by the box in the map above relate to Colorado precipitation? The following map, derived from NOAA’s Earth System Research Laboratory climate page, shows the correlation between ocean temperatures in the equatorial Pacific with precipitation across the U.S over the June – August period. Impressively, a large “bullseye” appears east of the Continental Divide over Colorado. This implies that El Nino conditions tend to favor above average precipitation over most of Colorado, but especially east of the Divide.
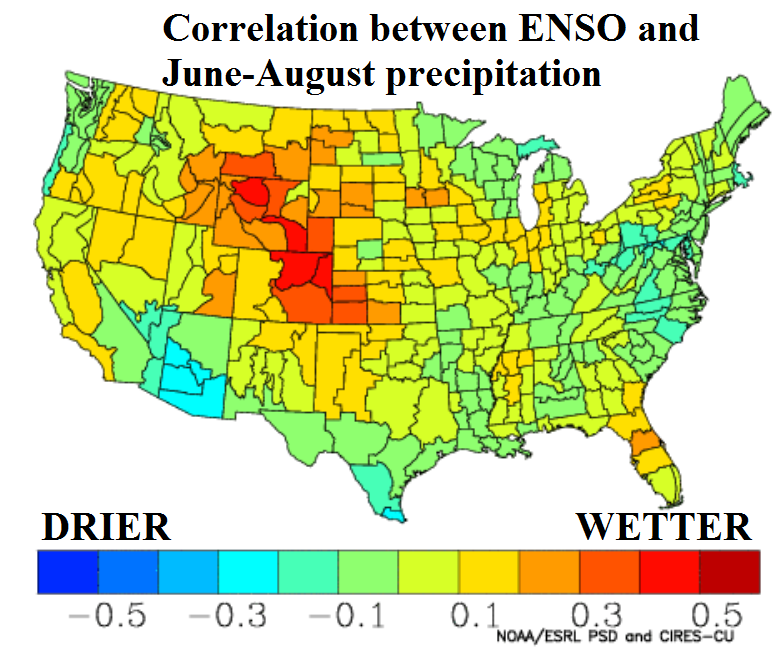 So what about longer-range forecasts? The Climate Forecast System, operated by the National Centers for Environmental Prediction, provides 9-month forecasts across the world. Below is a map showing the expected precipitation anomaly over the upcoming June-August period. The key word is: wet! It is also interesting how the model forecast is similar to what we have historically observed shown in the map above.
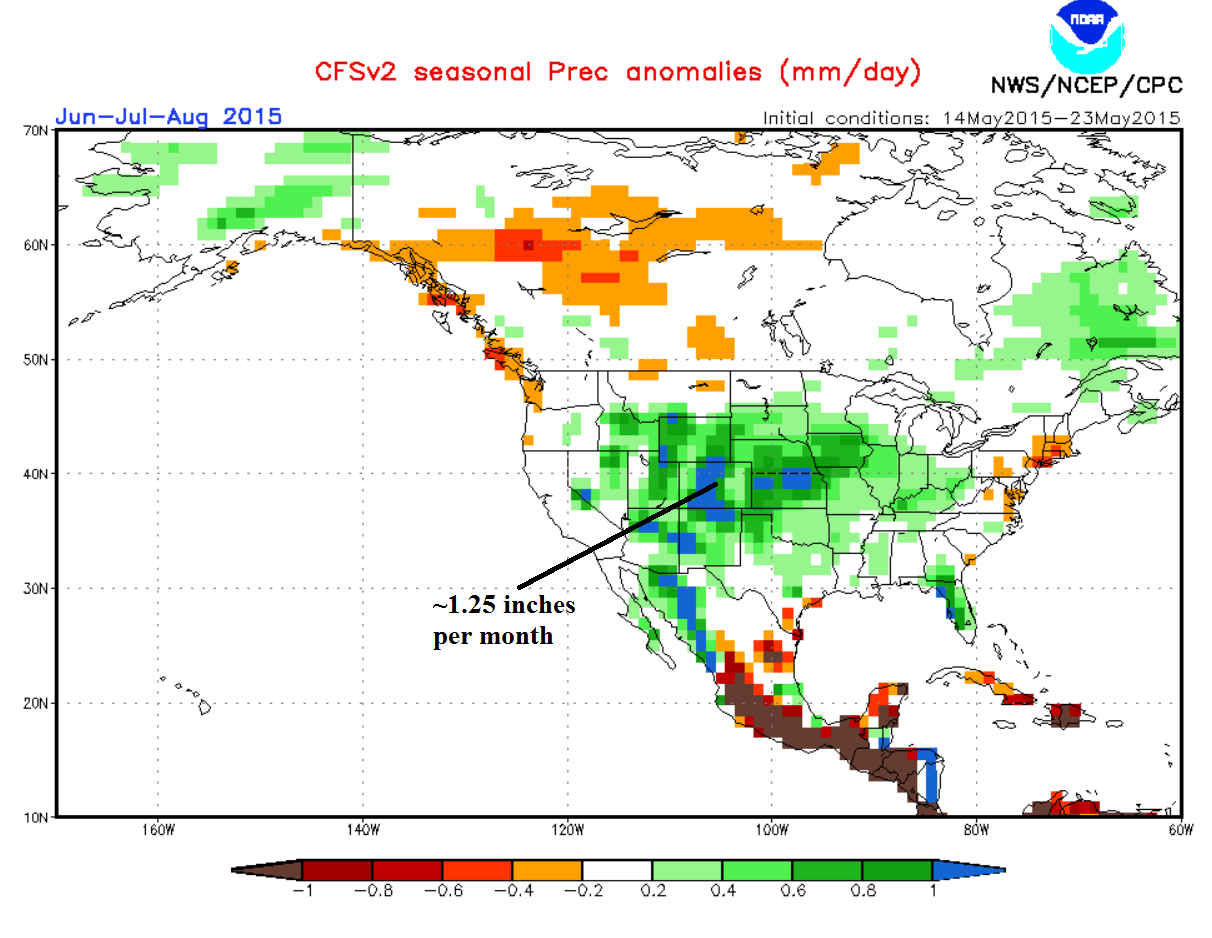 Note that anomaly refers to precipitation in relation to average. Just for reference, Colorado averages 2-4 inches of precipitation per month over that time period.
While no correlation or forecast is perfect, when we see key data line up, it allows us to build confidence in the upcoming summer forecast. It will be interesting to see how it evolves!