Issue Date: 9/28/2015
Issue Time: 4:30PM
*If you are looking for the Flood Threat Outlook, please scroll down to the next post.
Due to the extreme importance of the winter snowpack for our water supply, we decided to end the Flood Threat Bulletin season (our daily product ends on 9/30, while today is the last Flood Threat Outlook) with a special seasonal snowpack forecast for the state. Before we begin to discuss our findings, a disclaimer is in order: this is NOT an official forecast! It is simply our estimate of what we think this winter will bring.
What are we predicting?
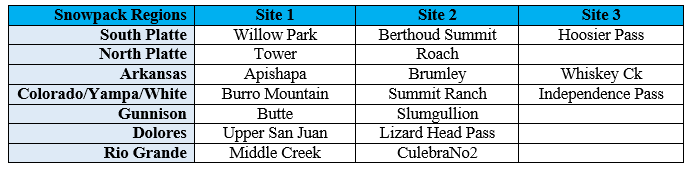
One of the most useful variables for water supply planning is the Snow Water Equivalent. But even more specifically, the maximum Snow Water Equivalent (hereafter, SWEmax), which generally occurs from March to early June. Because the SWEmax usually varies, sometimes significantly, across Colorado, we decided to split the state up into seven snowpack “regions”. These regions were established using watershed boundaries. The table below shows these regions as well as the 2 or 3 SNOTEL snow gauges that were used to characterize each basin. We only use gauges with 35+ years of data, in order to ensure a robust signal.
What do we use as predictors?
Our experience shows that forecasting streamflow and snowpack several months in advance requires a thorough analysis of large-scale atmospheric and oceanic conditions across the globe. These conditions are quantified through what we refer to as Hydro-Climate Indices (HCIs), which include commonly heard HCIs such as the El Nino-Southern Oscillation (ENSO) index, the Palmer Drought Severity Index (PDSI) and the Arctic Oscillation along with many others. Knowledge of the state of HCIs is important because they exert a large influence on weather patterns even far from their “home region”. For example, ENSO is defined using tropical Pacific SSTs, but can significantly influence precipitation patterns in Indonesia, Brazil and even the southeastern United States. Our experience suggests that ENSO and the PDSI are especially useful for long-range forecasting in Colorado. Thus, we will use these two indices as predictors. In addition, we will use the time rates of change, or tendencies, of these indices. For example, the ENSO tendency is currently strongly positive since El Nino conditions are developing (it would be negative if La Nina conditions are developing). Also, just to clarify, the term “ENSO” implicitly includes within it both El Nino and La Nina events.
Assembling the forecast ingredients
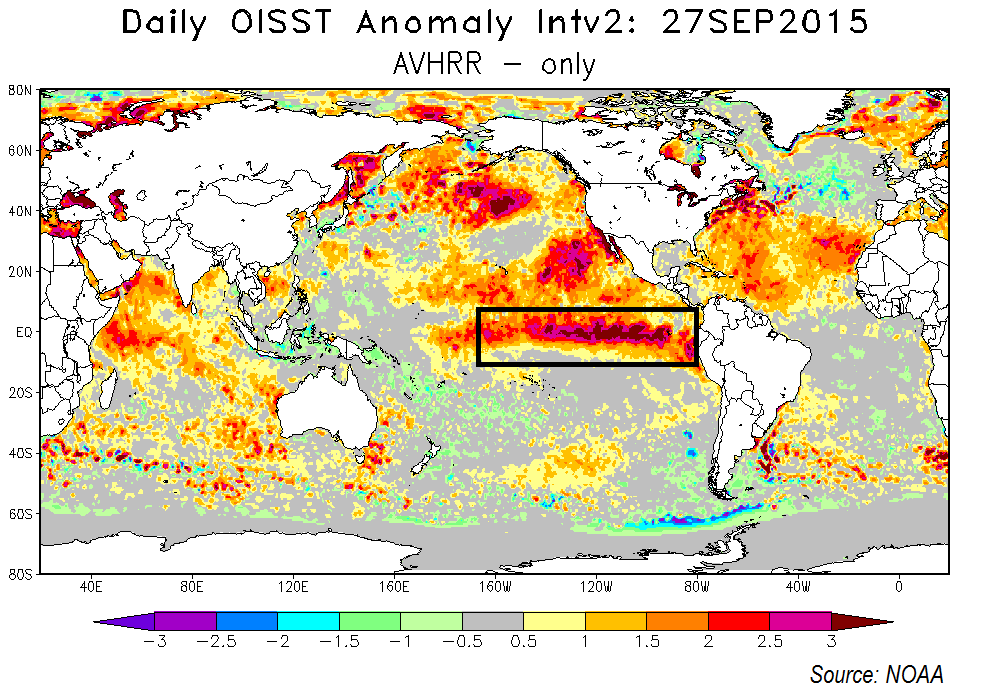
We began by looking at our two predictors. The figure below shows global sea-surface temperature anomalies. The region of importance is shown in the black box. Note the very strongly positive anomalies that characterize the moderate/strong El Nino event that we are currently experiencing. Through an anomalously active subtropical storm track, El Nino typically results in much higher than normal precipitation in Southern California and the southwest U.S. However, its impact on Colorado is limited to the southwest part of our state.
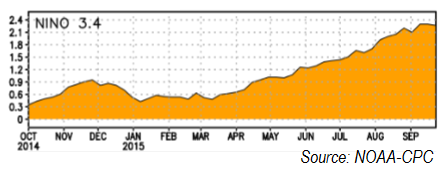
 Next, the chart below shows that sea-surface temperatures in the so-called NINO3.4 region (a way of measure the ENSO strength) have been steadily warming over the last 3-6 months. This is important, because unlike ENSO itself, a positive tendency in ENSO is associated with below normal snowpack across most of Colorado. Thus, the combination of a positive ENSO + positive ENSO tendency can result in a cancellation of either signal.
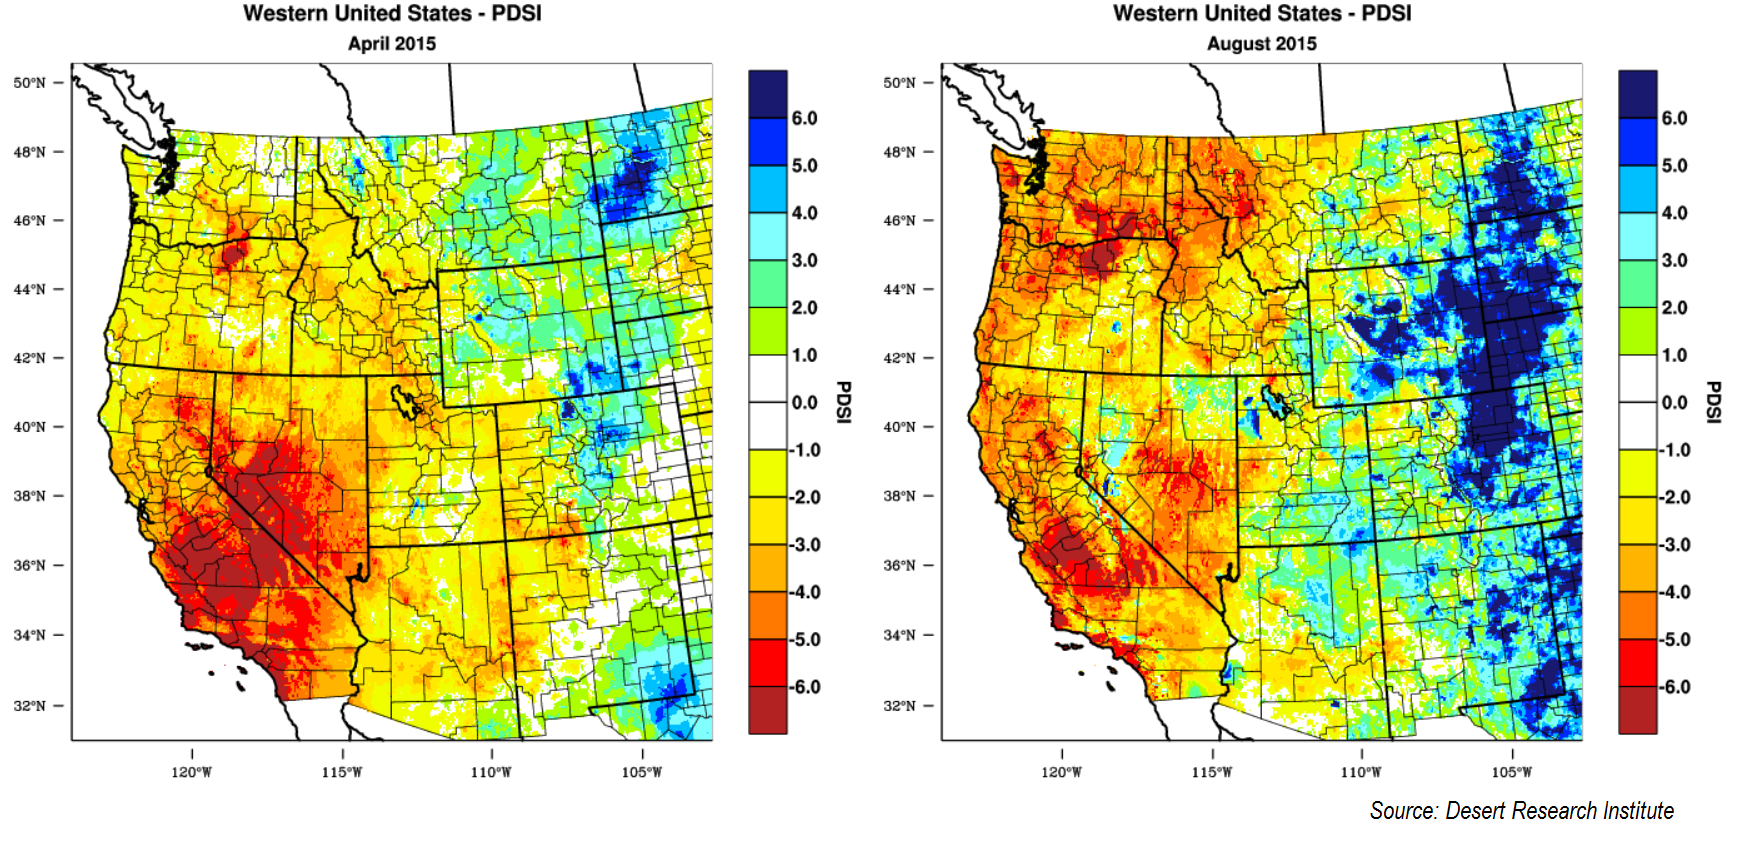
The next predictor we looked at was PDSI, and its tendency. The maps below show PDSI values across the western United States during April and August. Due to an incredibly wet spring/early summer, most of eastern Colorado has positive PDSI values. Meanwhile, it is clear that the PDSI tendency over the past ~6 months has also been positive across most of the southwest United States and the Rocky Mountain states. For example, look at southern Utah and northern Arizona. Due to land-atmosphere feedbacks, both positive PDSI and positive PDSI tendency suggest above normal snowpack across most of Colorado.
 2016 SWEmax Forecast
After building forecast models for each of our seven snowpack regions, we now present our 2016 SWEmax forecast in the map below. We present the results as a percentage of normal.
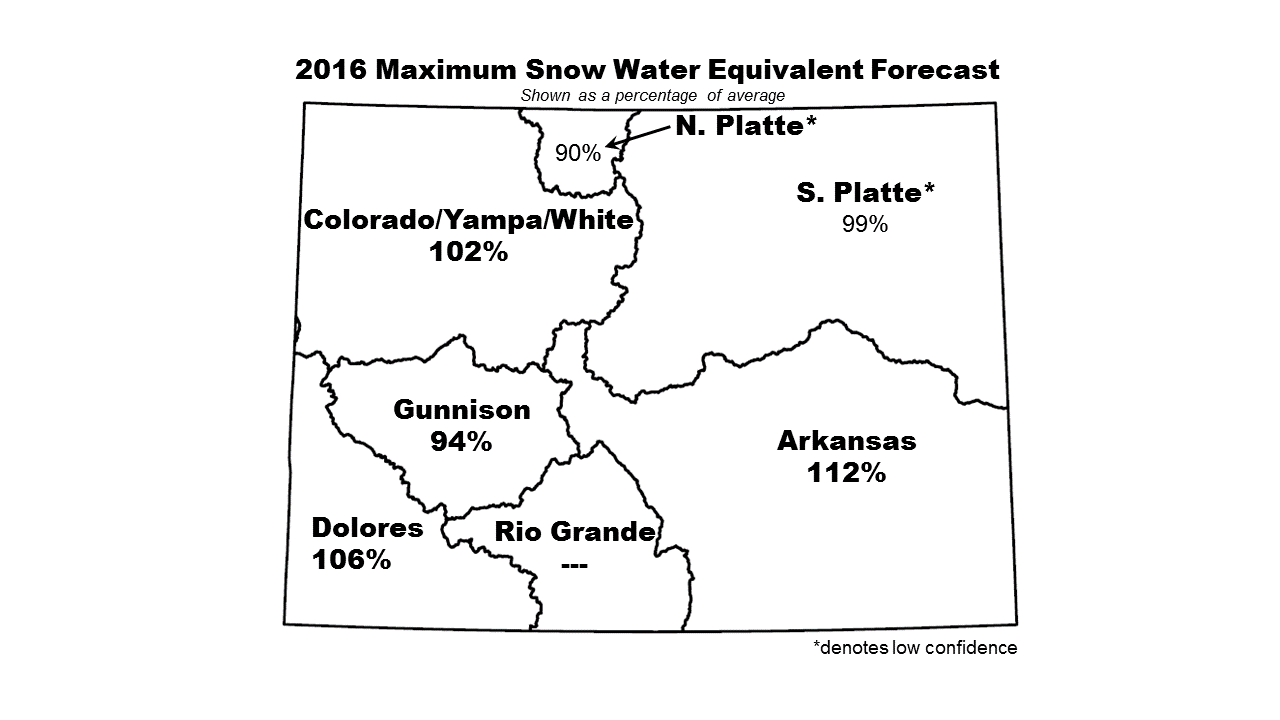 The North Platte and Gunnison basins are expected to see below normal SWEmax, while the South Platte basin is near normal. Meanwhile, above average SWEmax is expected in the Arkansas, Colorado/Yampa/White and Dolores basins.
A few other important issues:
- Note that the Rio Grande basin does not have a forecast. We could find any significant skill here using our four predictor variables. This is not entirely unexpected given the closed-in nature of the basin, which makes it less amenable to long-range predictions using the HCI methodology.
- Note that the North Platte and South Platte forecast numbers are italicized. This indicates that those forecasts have low confidence. However, low confidence is better than no confidence (as was the case for the Rio Grande).