Issue Date: Saturday, October 1, 2022
Issue Time: 9:45 AM MDT
Summary:
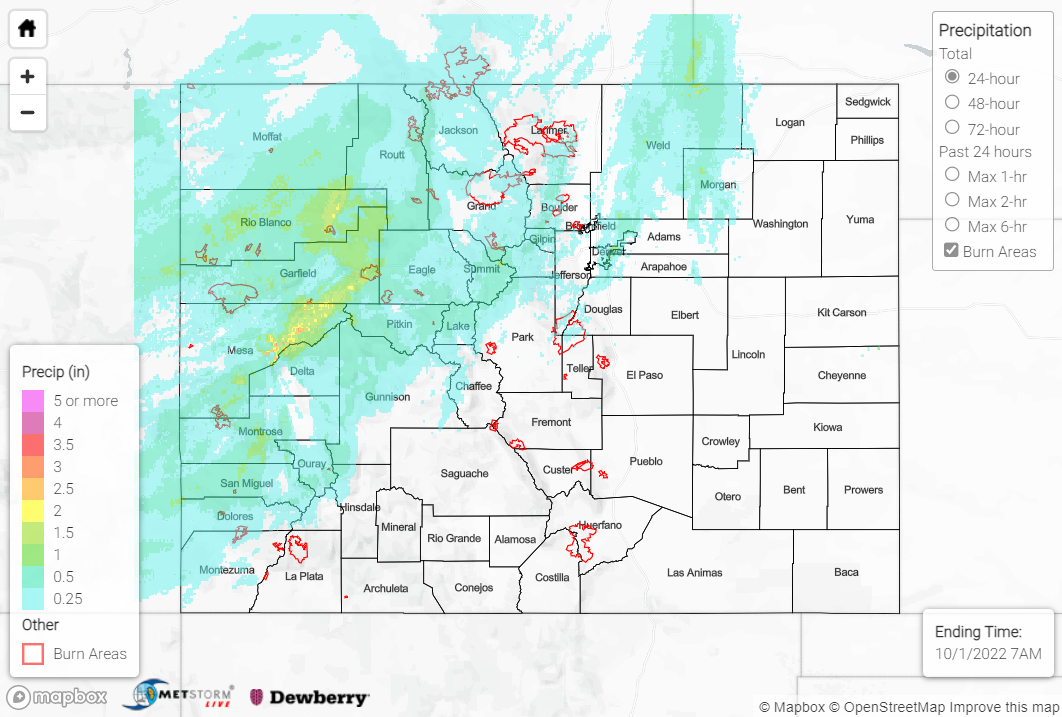
All good things must come to an end, but we sure had an active day of weather for the last SPM post of the 2022 season. Thanks to a cut-off upper-level low spinning over the northern Great Basin, scattered showers and storms overspread much of the northwestern half of the state on Friday. The heaviest rain was observed along and northwest of a line from roughly Durango to Sterling, while the southeastern half of the state remained largely dry.
Amounts of 0.25-0.75” were fairly commonplace where precipitation was observed, with locally higher amounts of 1-2+”. Stronger storms were observed along the western I-70 corridor near Grand Junction, prompting two Severe Thunderstorm Warnings and two Flood Advisories. No flooding was reported, but 0.25” hail was reported in Grand Junction. Mammatus clouds were even observed:
Nope, not the Plains. Just outside the Grand Junction NWS office a short while ago…#mammatus #cowx #utwx pic.twitter.com/kqvKyUmn5b
— NWS Grand Junction (@NWSGJT) October 1, 2022
Notable rainfall totals include the following:
• 2.80” near Paonia State Park
• 2.26”, 2.15”, and 1.81” east of Glenwood Springs
• 1.42” near Grand Mesa
• 1.16”, 1.10”, and 1.02” near Grand Junction
• 1.13” east of New Castle
• 0.98” southeast of Rifle
Some of the highest mountain elevations (10,000+ feet) experienced their precipitation in the form of snowfall yesterday:
This Loveland Pass webcam (at ~12,000 ft) reveals a fresh blanket of snow at the higher elevations, as the rising sun illuminates the higher peaks (Hagar Mtn, Pettingell Peak in the background). #COwx pic.twitter.com/KYyODdAw8P
— NWS Boulder (@NWSBoulder) October 1, 2022
Several USGS gauges in the Central and Northern Mountains are running at all-time highs for this day of the year thanks to yesterday’s rain, but no flooding was reported. For precipitation estimates in our area, check out the map below. Remember, if you observe flooding in your area, you can use the “Report a Flood” page to make a flood report when you can safely do so.
As alluded to above, this will be the last SPM post until next season. It has been a pleasure providing these daily posts for the state of Colorado throughout the 2022 flood season.
