Issue Date: Friday, September 23rd, 2022
Issue Time: 9:40 AM MDT
Summary:
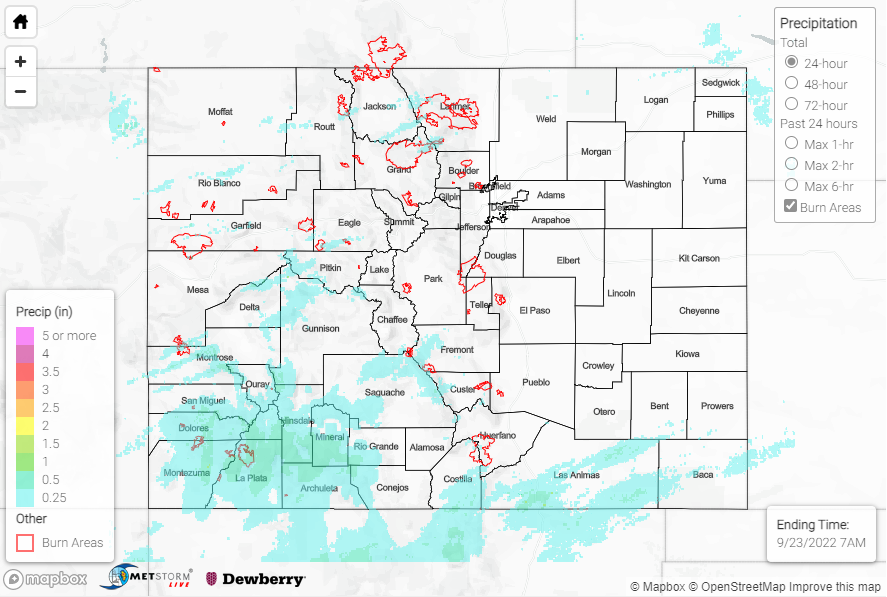
Rain continued across the state for the first half of the day on Thursday, albeit less widespread than on Wednesday; dry air began filtering in by late afternoon and clearing out the showers and storms. Many of the same regions experienced the highest precipitation totals, including the San Juan/Central Mountains and Southwest Slope, where QPE data suggests fairly widespread totals of 0.50-1.00”. These estimates are confirmed by rain gauge observations, including:
• 0.95” south of Durango
• 0.92” near Redmesa
• 0.75” near Durango
• 0.75” near Pagosa Springs
• 0.70” near Taylor Park Reservoir
• 0.68” near South Fork
• 0.50” north of Paonia
• 0.47” southwest of Uncompahgre Peak
Other regions that saw some of the heaviest precipitation totals include the Southeast Mountains southeastward across the Raton Ridge, where QPE data suggests similar totals of 0.50-1.00”. Rain gauge coverage is sparse, but these estimates are also confirmed by observations, including 0.91” south of Trinidad and 0.60” near Custer.
Elsewhere across the state, totals were light, with generally T-0.25” across the Grand Valley/Northwest Slope/Northern Mountains and T-0.15” across the Front Range/Urban Corridor/Palmer Ridge/Plains. On the backside of this departing system, dense fog was observed early this morning for many locations east of the Divide:
It’s foggy across parts of NE Colorado including…I-25 north of Longmont exit to Fort Collins, U.S. 34 from Loveland to Greeley to Fort Morgan, I-76 NE of Wiggins, & Limon eastward on I-70.
Slow down & use caution if you encounter the fog. #COwx pic.twitter.com/ZTxrGQIcpe
— NWS Boulder (@NWSBoulder) September 23, 2022
No flooding was reported yesterday. For precipitation estimates in our area, check out the map below. Remember, if you observe flooding in your area, you can use the “Report a Flood” page to make a flood report when you can safely do so.
Click Here For Map Overview