Issue Date: Friday, September 16th, 2022
Issue Time: 11:30 AM MDT
Summary:
Another shortwave trough passing over the state provided ample life to produce precipitation for most areas on Thursday. Similar to Wednesday, there were once again two main regions of heavier precipitation: 1) along and north of I-70 west of the Divide, and 2) over and surrounding the Palmer Ridge.
In the first heavier precipitation region (Grand Valley, Northwest Slope, Northern Mountains), QPE data suggests a general 0.25-0.50” with locally higher amounts. Some notable locally higher gauge observations include:
• 0.67” northeast of Craig
• 0.65” near Rio Blanco Lake
• 0.51” near Craig
Also of note in this region, temperatures were cold enough for snow to be observed along I-70 near Vail Pass. Additional reports of snow showers/flurries were received across the Central Mountains and San Juans.
We will just leave this here…taken earlier this morning #snow #COwx https://t.co/3RXUSy8s41
— NWS Grand Junction (@NWSGJT) September 15, 2022
For the second and heaviest precipitation region (Palmer Ridge vicinity), QPE data suggests that storms produced up to 1.00-1.50” of rainfall, particularly across Kit-Carson and Cheyenne Counties. Notable rain gauge observations include:
• 1.14” near Cheyenne Wells
• 1.06” near Limon
• 0.99” near Kit Carson
Heavier rainfall totals of up to 0.75” were also observed along and north of the I-76 corridor, including 0.62” near Snyder, but these totals were more isolated. Elsewhere across the state, precipitation amounts were generally 0.25” or less.
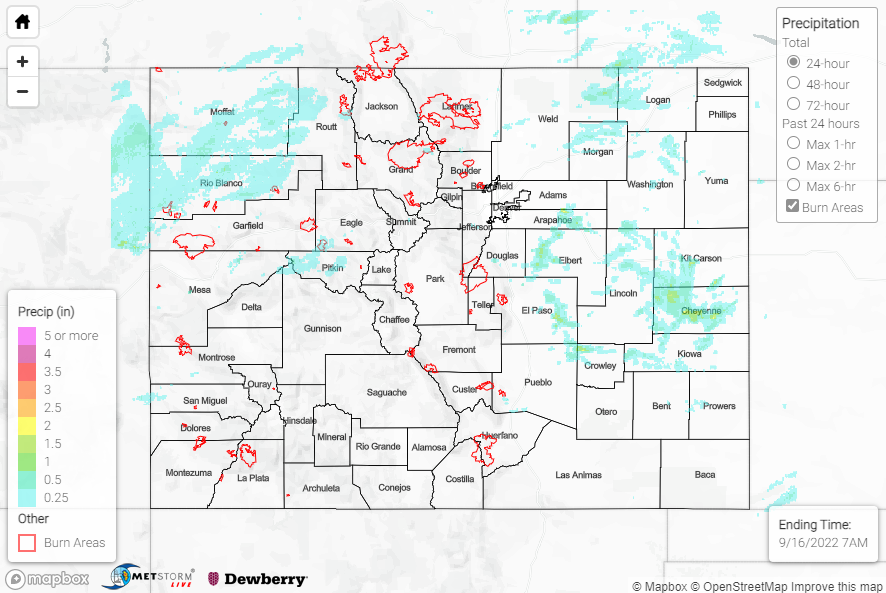
No flooding was reported yesterday. For precipitation estimates in our area, check out the map below. Remember, if you observe flooding in your area, you can use the “Report a Flood” page to make a flood report when you can safely do so.
Click Here For Map Overview