Issue Date: Monday, August 29th, 2022
Issue Time: 10:55 AM MDT
Summary:
Sunday featured an uptick in precipitation across the state compared to Saturday, although showers and storms were mainly limited to the mountains along and south of I-70.
QPE data suggests amounts of 0.50-1.00” from the Central Mountains southward into the San Juans, Southeast Mountains, and Southwest Slope. Flood Advisories were issued for portions of San Miguel and Dolores Counties, but no flooding was reported. Notable rainfall totals include 1.04” and 0.67” near Durango and 0.50” near Paonia Reservoir. A Severe Thunderstorm Warning was also issued for portions of Garfield County, but no severe weather was reported there.
Farther north into the Northern Mountains, precipitation totals were lower, with generally 0.50” or less. 0.47” was measured by a rain gauge near Gypsum. A Flood Advisory and Flash Flood Warning were issued for portions of the East Troublesome burn scar, but no flooding was reported. To the west of East Troublesome near Steamboat Springs, 0.25” hail was reported by the public.
Out west in the Grand Valley near the Utah border, non-thunderstorm gusty winds up to and exceeding 60 mph were measured by several weather stations.
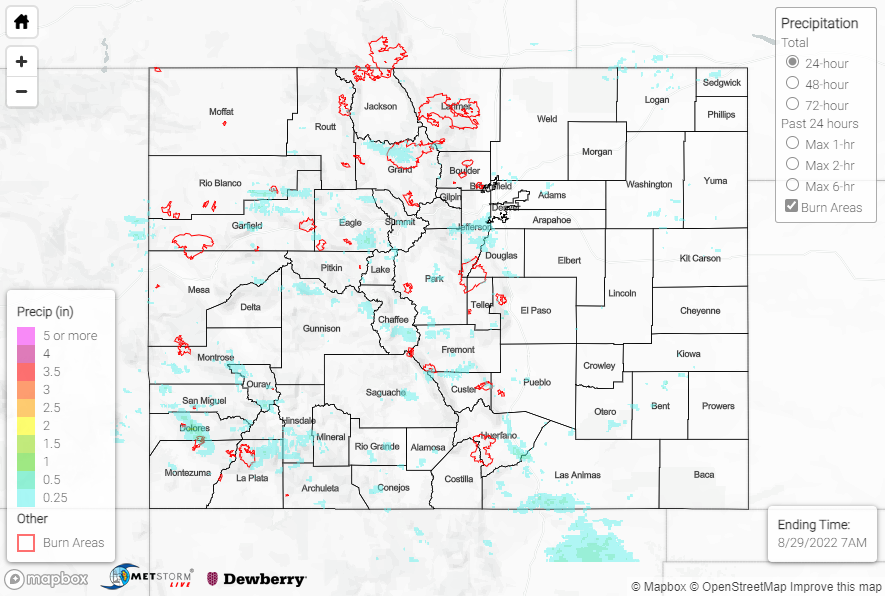
No flooding was reported on Sunday. For precipitation estimates in our area, check out the map below. Remember, if you observe flooding in your area you can use the “Report a Flood” page to make a flood report, when you can safely do so.
Denver’s radar is down for maintenance upgrades through the end of August. QPE may be underestimated across the region.
Click Here For Map Overview