Issue Date: Saturday, August 27th, 2022
Issue Time: 11:30 AM MDT
Summary:
Friday was an eventful day for much of Colorado, and the Eastern Plains finally got a bit more share of the action too. Early morning was kicked off with scattered showers and thunderstorms already occurring on the Southwest Slope and in the San Juan Mountains. By afternoon, daytime heating and available moisture allowed for further storm development, especially along the high terrain of the Northern, Central, San Juan, and Southeast Mountains. This was followed by general eastward progression associated with a surface low that allowed storms to spill onto the Urban Corridor, Palmer and Raton Ridges, as well as the Eastern Plains. Throughout the afternoon there were numerous storms covering nearly the entire state, though the most intense rainfall occurred on the Southwest Slope and Eastern Plains. Many creeks and rivers across Southern Colorado saw a quick boost in streamflow thanks to the rainfall, though none officially entered flood stage. Storms lingered well into the evening and overnight hours on the Eastern Plains ahead of a general drying pattern from the west as storms pushed towards the Kansas and Nebraska borders.
Only a few flood advisories and warnings were issued yesterday. One flood advisory was issued for the Cameron Peak burn scar, which saw up to 0.28 inches of rain along Highway 14 at Roaring Creek. The Pine Gulch burn scar had a flash flood warning yesterday as well – QPE from MetStormLive puts up to 0.5 inches of rain in the area. Just south in Grand Junction, a CoCoRaHS observer also reported 0.52 inches of rain. Thankfully no flooding has been reported on either burn scar so far.
The last flood advisory issued yesterday was for southwest Colorado right on the Utah border. A CoCoRaHS observer in Slick Rock (within the advisory area) reported 1.08 inches in their gauge yesterday, along with the following remark:
After reviewing all 12 years of my records (which began 9/1/2010), I find that this is the third largest amount of daily precipitation. Of the 1.08 inch, 0.95 inch fell between 12:15 pm and 1:15 pm, with the large majority of that between 12:30 pm and 1:00 pm
A total of 0.95 inches in one hour for this part of the state exceeds the 10-year ARI precipitation frequency estimate of 0.87 in one hour. In other words, rainfall of that magnitude has less than a 10% chance of occurrence in any given year!
CDOT also reported rocks on the road on US60 near Wolf Creek Pass yesterday evening. A total of 0.37 inches was reported from the automated weather station on top of the pass. There were also rocks on CO 119, two miles south of Blackhawk. Only 0.27 was reported in Blackhawk from a CoCoRaHS observer, but up to 0.56 was reported just northwest in Rollinsville (including small hail). Both roadways have since been cleared and reopened.
Some other notable high precipitation totals for Southern and Western Colorado include:
- 0.85 in Durango
- 0.83 in Lake George
- 0.80 in Trinidad
- 0.76 in Salida
- 0.71 in Pagosa Springs
While on the Eastern Plains, even higher totals were reported including:
- 1.25 in Eads
- 1.17 in Lamar, also associated with a 59 mph thunderstorm wind gust
- 1.17 in Stratton
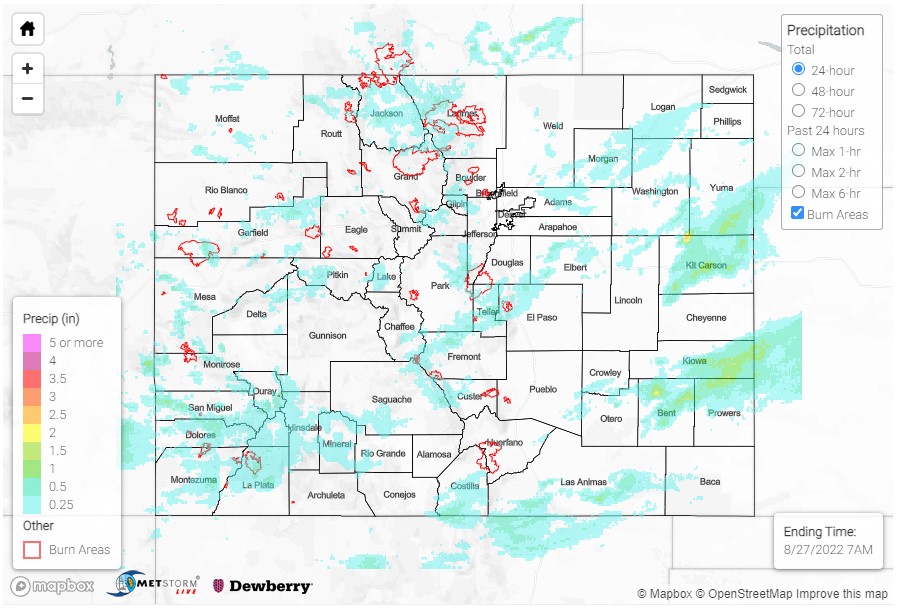
If you observe flooding in your area, remember to use the “Report a Flood” page to make any flood reports when you can safely do so. For precipitation estimates in our area, check out the map below.
Another reminder, Denver’s radar is down for maintenance upgrades through the end of August. QPE may be underestimated across the region.
Click Here For Map Overview