Wednesday was a repeat of Tuesday, with precipitation confined to the highest terrain and in many of the same locations. Storms were of the pulse variety, quickly forming and then collapsing with limited potential for severe weather.
Rainfall was once again observed at high elevations from the Northern Mountains southward into the San Juans and Southeast Mountains, while the heaviest rainfall appears to have fallen across portions of the San Juans and into the western slope; amounts of 0.50-1.25” are indicated by QPE data. Flood Advisories were issued for both the Cameron Peak and East Troublesome burn scars, but no flooding was reported. Near the southern Northwest Slope/northern Grand Valley over the Roan Plateau, Flood Advisories were issued for portions of the Pine Gulch burn scar in Garfield County; no flooding was reported. Lastly, storms over the Southwest Slope near Cortez in Montezuma County prompted another Flood Advisory, with no flooding reported.
Notable rainfall totals from the southwest quadrant of the state include 1.12” near Durango, 1.08” near Del Norte, 1.06” near Cortez, 0.93” near La Garita, and 0.90” near Lewis. This total near Lewis was reported as falling in 30 minutes, which has an estimated ARI of about 14 years! Rain gauge observations across the rest of the state were light, being generally 0.25” or less.
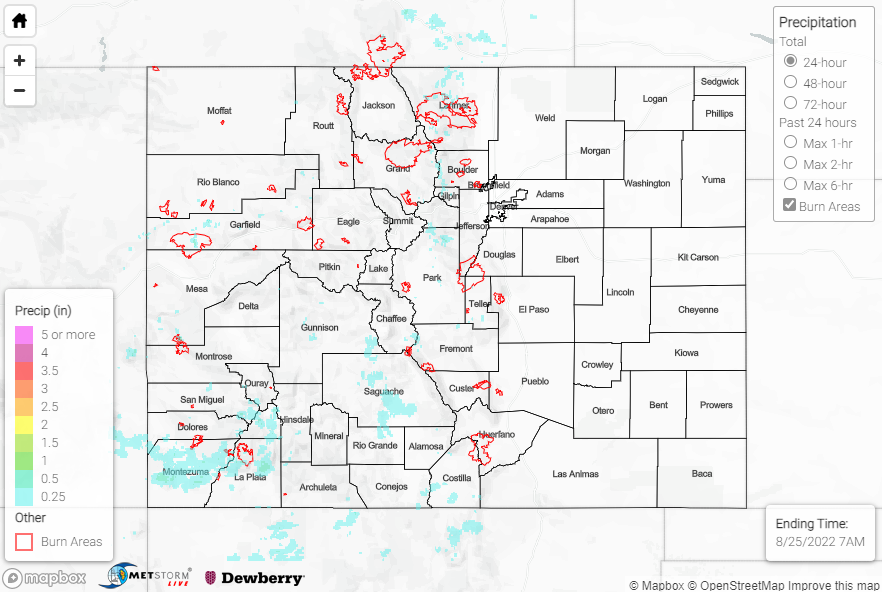
If you observe flooding in your area, remember to use the “Report a Flood” page to make any flood reports when you can safely do so. For precipitation estimates in our area, check out the map below.
Click Here For Map Overview