Issue Date: Thursday, August 18th, 2022
Issue Time: 9:45 MDT
Summary:
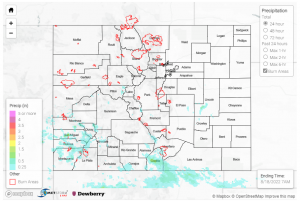
The Front Range and Urban Corridor finally got a break from the rain yesterday. Denver and Fort Collins saw a significant decrease in precipitation, with most observations reported as 0.05” or less. A few notable observations include 0.17” in Superior and 0.2” in Fort Lupton. Moving south, Colorado Springs and Pueblo saw the same trend, with reports of just 0-0.01″ observations as the majority for both cities. A severe thunderstorm warning was issued for southwest Lincoln County to the northwest of Pueblo, but the storm weakened and the warning ended shortly after it was issued.
Three flood advisories were issued yesterday, two west of Telluride and one southeast of Pagosa Springs bordering New Mexico. Within the flash flood warning boundary just west of Telluride, there was another debris flow over Highway 145, reported by CDOT at 3:44 PM. Placerville nearby received up to 0.8”, via CoCoRaHS, along with reports of moderate to heavy rain and thunder. 1.06” was also reported near Mancos, but that was the highest rainfall observed in the Southwest Slope region- most other observations were between 0” and 0.4”. In the San Luis Valley, up to 0.55” was reported, near Alamosa, while the Raton Ridge only saw up to 0.15”.
The Central Mountains saw up to 0.37” but similarly less than the last few days. The Grand Valley and Northwest Slope stayed dry, and the Eastern Plains followed suit with observations of only up to 0.02” via Mesowest gages.
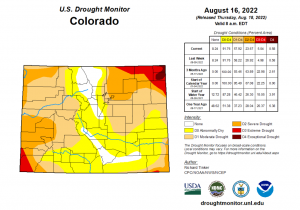
The updated drought monitor was released today, shown below. Improvements include a decrease in the percentage of land in the Moderate and Severe Drought categories. However, percentages in the categories of None, Abnormally Dry, and Exceptional Drought stayed the same from last week.
If you observe flooding in your area, remember to use the “Report a Flood” page to make any flood reports when you can safely do so. For precipitation estimates in our area, check out the map below.

