Issue Date: Wednesday, August 3rd, 2022
Issue Time: 11:15 AM MDT
Summary:
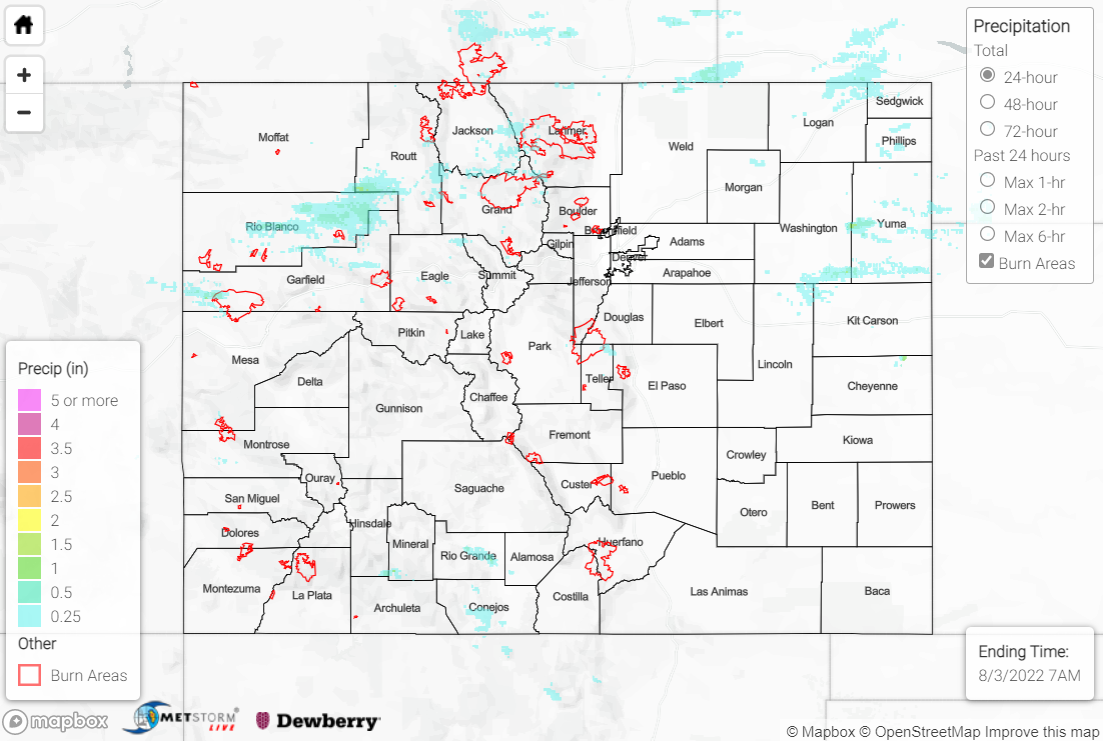
A shortwave trough moving across the region on Tuesday helped to produce showers and storms over portions of the high terrain and Northeast Plains, although limited instability precluded more widespread rainfall and severe weather.
The heaviest rain in the state fell across the southern San Juan Mountains where better moisture was available, with QPE data suggesting localized amounts of up to 2”. The Grand Junction radar went back online yesterday afternoon, so QPE totals appear reasonable after being underestimated over the past week. Rain gauge observations are sparse, but an automated station south of Bayfield measured 1.62”. A Flash Flood Warning was issued for west-central Archuleta County, with law enforcement reporting a mudslide/debris flow west-southwest of Pagosa Springs on Highway 160 at mile marker 130. Another mudslide/debris flow was reported west of Antonito near the intersection of Highway 17 and County Road D5.
Farther north, QPE data suggests 0.25-0.50” of rain fell across the northern Grand Valley, southeast Northwest Slope, and Northern Mountains, with localized amounts up to 1”. Flash Flood Warnings were issued for the Pine Gulch burn scar and southeast Moffat/west-central Routt Counties, but no flooding was reported. Flood Advisories, also with no flooding reported, were issued for central Rio Blanco County, as well as portions of the East Troublesome and Cameron Peak burn scars. Notable rain gauge observations include 0.62” at an automated station north of Glenwood Springs and 0.42” from a CoCoRaHS observer south of Steamboat Springs.
Across the Central Mountains, Front Range, and Urban Corridor, much lighter precipitation amounts of T-0.15” were generally observed. In the eastern Northeast Plains, QPE data suggests highly localized amounts of up to 1”, particularly across Washington and Yuma Counties.
If you observe flooding in your area, remember to use the “Report a Flood” page to make any flood reports when you can safely do so. For precipitation estimates in our area, check out the map below.
