Issue Date: Sunday, July 17th, 2022
Issue Time: 10:00 AM MDT
Summary:
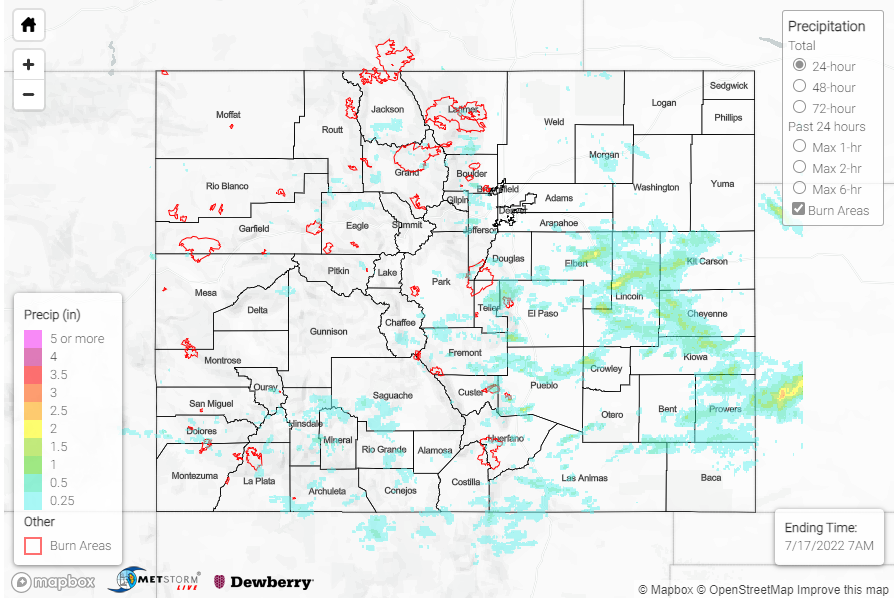
The Urban Corridor received the bulk of the precipitation yesterday, although the northeast and central south also saw healthy amounts of rainfall. Denver received up to 0.41” from a short period of afternoon showers, while Fort Collins only received about 0.22”. Most of the surrounding areas also received less than 0.05”. South of Denver, Colorado Springs received up to 0.7” and Pueblo 1.04”. The Front Range received higher totals however, including 1.02” in Evergreen, 0.68” near Divide, and 0.57” near Estes Park.
To the east, two severe thunderstorm warnings were issued for the central Plains. Northwest of those in Wild Horse, CO was a report of thunderstorm wind damage from 0.5” hail to siding on a house/furniture blown over. A dust storm was also reported nearby, which apparently limited visibility to ¼ mile. Via the report, it last about 10 minutes on US 287 from east of Wild Horse to west of Kit Carson. Some significant rainfall totals in the area include:
-0.67” in Holly
-0.82” in Karval
-0.92” in Liberty
-0.73” in Agate
Lastly, in the south, Trinidad was issued a severe thunderstorm warning and precipitation totaled 0.91” via CoCoRaHS. In Colorado City to the north, 1.12” was reported, along with several reports of ponding in fields and yards from the heavy rainfall. To the west, Pagosa Springs saw up to 0.22”, but most other areas received 0-0.05”. The North and Central Mountains saw some storms as well, but rainfall generally was under 0.2″. Athough there were flood advisories issued for the East Troublesome and Grizzly Creek burn scars, no flooding was reported.
If you observe flooding in your area, remember to use the “Report a Flood” page to make any flood reports when you can safely do so. For precipitation estimates in our area, check out the map below.
