Issue Date: Tuesday, June 28th, 2022
Issue Time: 9:45 AM MDT
Summary:
Building high-pressure to the west of Colorado allowed for mostly clear skies and limited rainfall potential yesterday. Still, some isolated high-based showers and storms were able to develop in the early afternoon in the Southwest Slope, San Juan Mountains, and Central Mountains. As the afternoon progressed, discrete but widely scattered cells extended into the Northern Mountains, Front Range, and Southeast Mountains as well.
In Western Colorado, daily maximum dewpoint temperatures increased the further south in the state. Dewpoints in the 40s were seen in the Grand Valley and Central Mountains, compared to mid-to-upper 50s for the Southwest Slope and San Juan Mountains, which corresponded with the highest precipitation totals in the state yesterday.
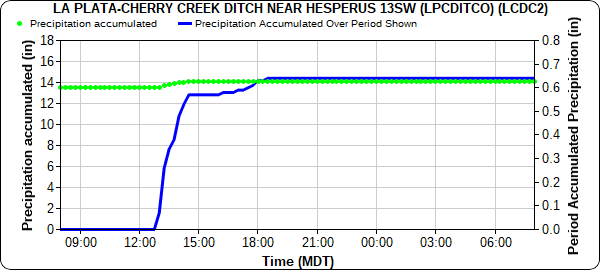
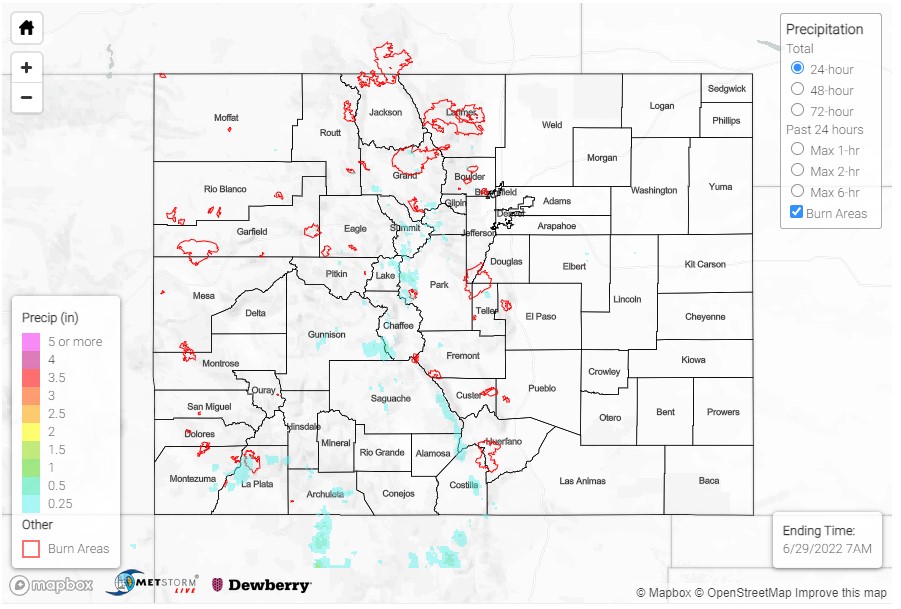
One CoCoRaHS observer in Pagosa Springs reported 0.84 inches yesterday, though other observations around town are between 0.04-0.28 inches. A quick storm west of Durango dropped 0.64 after noon, as seen in the hyetograph below from La Plata-Cherry Creek Ditch near Hesperus. The isolated nature of yesterday’s storms is also seen in the QPE below, with pockets of higher accumulations limited to higher elevations of the San Juan, Central, and Southeast Mountains.
The eastern half of the state remained hot and dry, with temperatures across the Urban Corridor, Northeast Plains and Southeast Plains reaching into the 90s. There was no flooding reported yesterday. For precipitation estimates in your area, check out the map below.
Note: The Grand Junction radar is down for maintenance. This will impact the accuracy of QPE, especially in the southwestern portion of the state.

