Issue Date: Saturday, June 25th, 2022
Issue Time: 10:25 AM MDT
Summary:
Yesterday we saw scattered showers across Colorado, more widespread across Colorado than Thursday. In the west, there were high thunderstorm gusts right on the border of Utah in Dove Creek, up to 51 mph. There were also winds recorded up to 58 mph in Rifle- both of these were observed in the afternoon yesterday. Across the western mountains and southwest, rainfall occurred generally in the late morning- 0.24” in Placerville with similar totals to the west, up to 0.22” near Durango, 0.48” in El Jebel and 0.33” near Carbondale. Some areas, such as Placerville, had reports of small hail as well.
The Front Range saw up to 0.32” west of Denver in the mountains, while most precipitation totals along the I-25 corridor between Denver and Pueblo were between 0” and a few hundredths of an inch. While no flooding was reported over any of the mountain burn scars east of the Urban Corridor, one CoCoRaHS reporter did note minor street flooding in their neighborhood in Boulder. There was also some small hail reported in this area.
Lastly, the central plains near the Kansas border saw storms in the late afternoon and evening hours. Three thunderstorm warnings, overlapping an area that spanned into Kansas, were issued between 4-8 p.m. yesterday. Associated with these were a handful of hail reports- pea to a half-inch size in Bethune, along with high winds. At the south of the storms in Cheyenne Wells, dime to nickel sized hail was observed (less than 1″ across). Burlington received the heaviest totals- 0.95” and 0.44” among others.
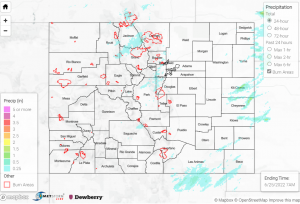
For precipitation estimates in your area, check out the map below.
Note: The Grand Junction radar is still down for maintenance. This will impact the accuracy of QPE, especially in the southwestern portion of the state.
