Issue Date: Saturday, June 18th, 2022
Issue Time: 9:45 AM MDT
Summary:
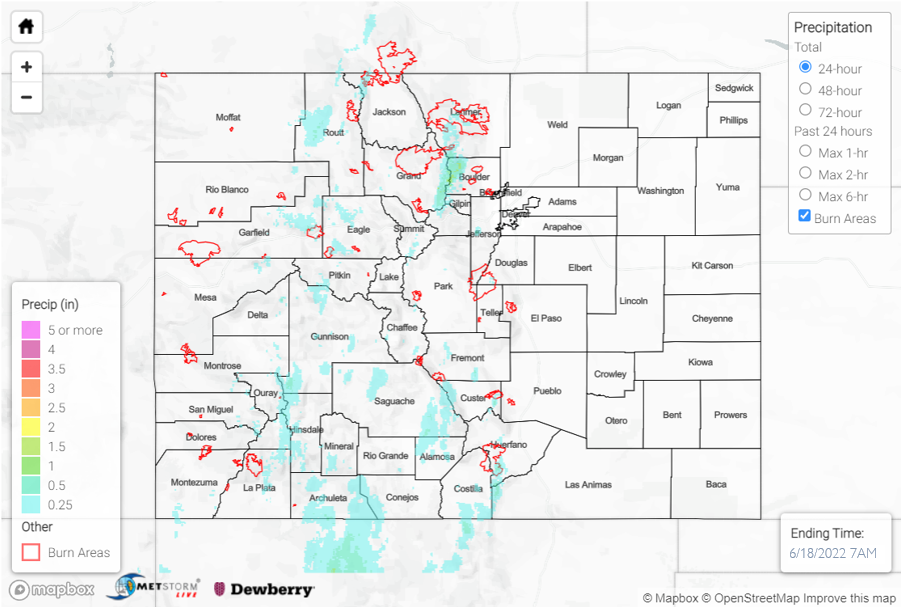
A steady plume of northward-moving subtropical moisture brought numerous rain showers and thunderstorms across western Colorado yesterday afternoon through the overnight hours. NWS Pueblo issued a late-morning flash flood warning over the Spring Creek burn scar, and their 12:01pm update estimated rain rates of 0.5 to 1 inch per hour over the burn scar. This flash flood warning was allowed to expire at 2:45pm as the heavy rainfall moved out of the area, and no flood reports were associated with the storm.
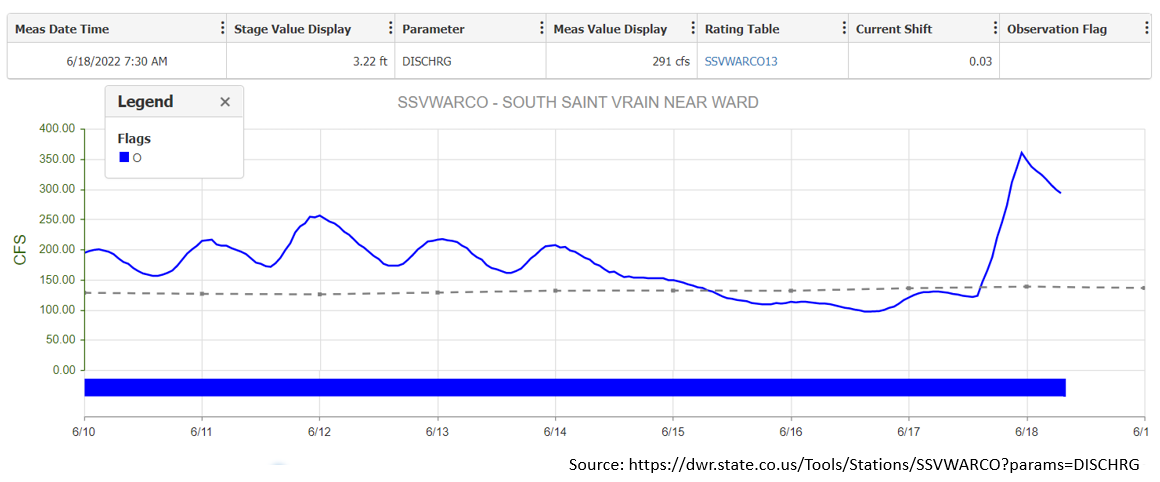
More notably, heavy rainfall also occurred just to the northwest of Nederland in the mid-afternoon, where a high elevation SNOTEL gage recorded a total of 1.2 inches of rainfall over the Indian Peaks. In the Allenspark area, 0.65 inches and 0.75 inches of precipitation were recorded by personal weather stations. A notable response to this heavy rainfall was observed by the South Saint Vrain river gage near Ward, which measured a noteworthy spike in streamflow at 11pm last night, as shown by the streamflow graph below. This peak in river flow even exceeded its snowmelt peak from earlier this week!
There was some disagreement in QPE estimations, but it appears possible that up to 1.5 to 2 inches of QPE occurred over a 2 to 3 hour period in the vicinity of the heaviest rainfall northwest of Nederland yesterday afternoon. Elsewhere across the western half of the state, QPE was more along the 0.25 to 0.5 inch range. Additionally, several wind reports were made across western Colorado in the afternoon. The highest wind gusts of 60mph and 66mph were recorded in Pitkin County at 1:49pm and 2:49pm, respectively.

