Issue Date: Friday, June 17th, 2022
Issue Time: 9:45 AM MDT
Summary:
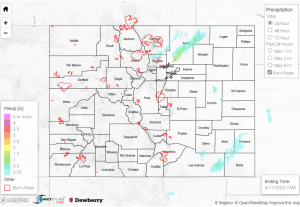
The majority of the state continued to be precipitation-free, with little to report aside from the high temperatures and a report of non-thunderstorm wind gusts of 55 mph at the Cortez Municipal Airport. However, the northern Urban Corridor region saw a fair amount of rainfall and thunderstorms, and the Southeast Plains had some storm activity as well.
The northern Front Range and Urban Corridor saw the bulk of the action yesterday. Two severe thunderstorm warnings were issued between Greeley and Brighton last night, along with multiple reports of hail and high winds. There were 7 reports of hail in this area – most described 1” hail, but a few public reports in Hudson mentioned up to 1.25″-1.5”. Wind gusts were reported up to 82 mph. Rainfall in this area varied depending on location but ranged from 0” and trace amounts up to over half an inch. Even closer to the mountains, northeast of Longmont, received up to 0.34” of rainfall and had some small hail reports as well. The highest precipitation observations from yesterday include:
– Up to 0.53” in Greeley
– 0.66” and 0.62” in Loveland
– 0.56″ in Kersey (one CoCoRaHS reporter noted “intense lightning”)
That lightning, associated with yesterday’s thunderstorms along I-25, seemed to capture the attention of many – see below for an excellent shot.
⚡️Spectacular #lightning peppered the northern front range last night with moonrise on the horizon.
You can drive a thousand miles for storms…only to take a quality photo by riding a bicycle 300 yards away from your house!
Ft. the @AnheuserBusch @Budweiser brewery. #COwx pic.twitter.com/agUrheIfu8— Michael Charnick (@charnick_wx) June 17, 2022
Down in the Southern Plains near Lamar, another severe thunderstorm warning was issued in the late afternoon, with rainfall coming in at 0.21” and 0.39”. The brief storm was accompanied by a report of hail that was 0.75” in size, and 55 mph wind gusts.
There was no flooding reported yesterday. For precipitation estimates in your area, check out the map below.
