Issue Date: Sunday, June 5th, 2022
Issue Time: 10:40 AM MDT
Summary:
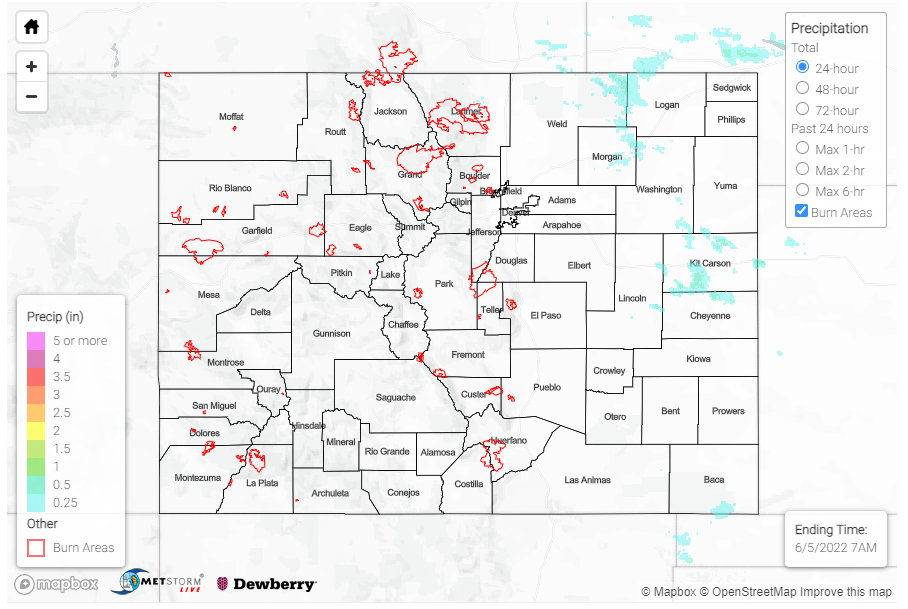
Saturday was much less eventful compared to the active severe weather day seen on Friday for the state. Still, isolated showers and thunderstorms began to form along the Northern Mountains and Front Range in the early afternoon from daytime heating, before progressing eastward off the mountains and onto the Urban Corridor, Palmer Ridge and Northeast Plains as the day continued. Residual outflow boundaries from storms the day before allowed for numerous thunderstorms, some severe, to develop on the Northeast Plains, mainly along the I-76 and I-70 corridors.
The main threats from severe thunderstorms were high winds and damaging hail, rather than heavy rainfall. Both a funnel cloud and landspout were reported in rural Kit Carson and Yuma counties, respectively; but most of the severe action remained on the Kansas side of the border.
Just 0.15 inches from storms was reported by a CoCoRaHS observer in Burlington, and Fort Morgan saw the highest precipitation observation of the day from an observer who reported 0.26 inches. MesoWest gauges near Burlington show all the precipitation falling in just about an hour period after 6:00pm. By late evening, most thunderstorm activity had moved well into Kansas and Nebraska.
Western and Southern Colorado remained largely dry yesterday, aside from a few isolated showers in the very far southeast corner of the state along the Oklahoma border. There was no flooding reported yesterday. For precipitation estimates in your area, check out the map below.
