Issue Date: Wednesday, June 1st, 2022
Issue Time: 10:00 AM MDT
Summary:
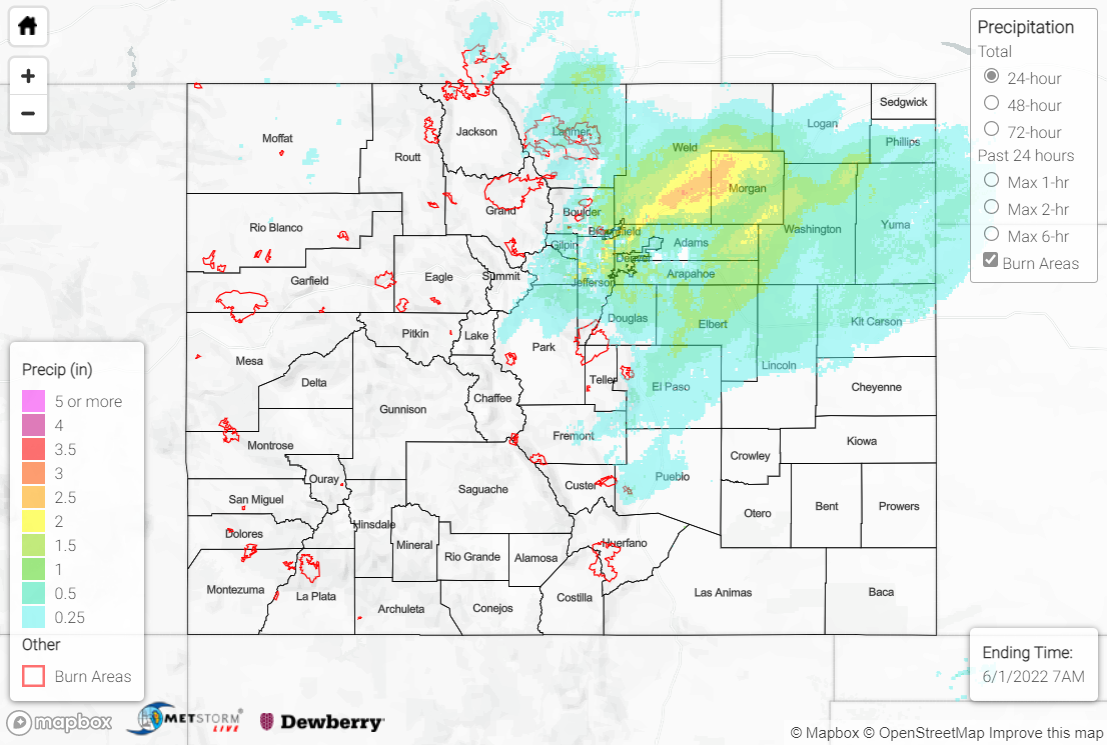
Several meteorological factors came together across the state on Tuesday to produce heavy precipitation across the Front Range, Urban Corridor, Palmer Ridge, and Northeast Plains. Moisture advection on upslope flow, mid-level frontogenetical forcing, and an impressively strong upper-level jet stream led to a blossoming of precipitation by yesterday afternoon across the aforementioned forecast zones. Rain, with snow at higher elevations, continued the rest of the day and into today.
The precipitation fell at moderate to occasionally heavy rates, with the most intense precipitation occurring from Denver northeast along I-76. Precipitation totals along this corridor ranged from 1.00-1.50”, with a few locations recording totals approaching 2.00”; a CoCoRaHS observer near Evergreen reported 1.71”. The rest of northeastern Colorado generally saw anywhere from 0.25-0.75”, with the lowest totals along and south of the Palmer Ridge.
Denver officially recorded 1.22” of rain, making it the largest single-day accumulation since May of 2021:
🫧 1.22″ of rain officially in Denver (DIA) makes this our biggest rainstorm in over a year!
Last storm this big: 1.30″, May 22-23, 2021. #9wx #COwx pic.twitter.com/1CfnWDSMVU
— Chris Bianchi (@BianchiWeather) June 1, 2022
High elevations of the Front Range once again saw late-season snowfall, with over 16” reported by a CoCoRaHS observer near Idaho Springs! Nine different creeks along the Urban Corridor are running at all-time highs for this day-of-year, per the USGS; none, however, are in flood stage.
There was no flooding reported yesterday. For precipitation estimates in your area over the last few days, check out the map below.
