Issue Date: Monday, May 30th, 2022
Issue Time: 11:30 AM MDT
Summary:
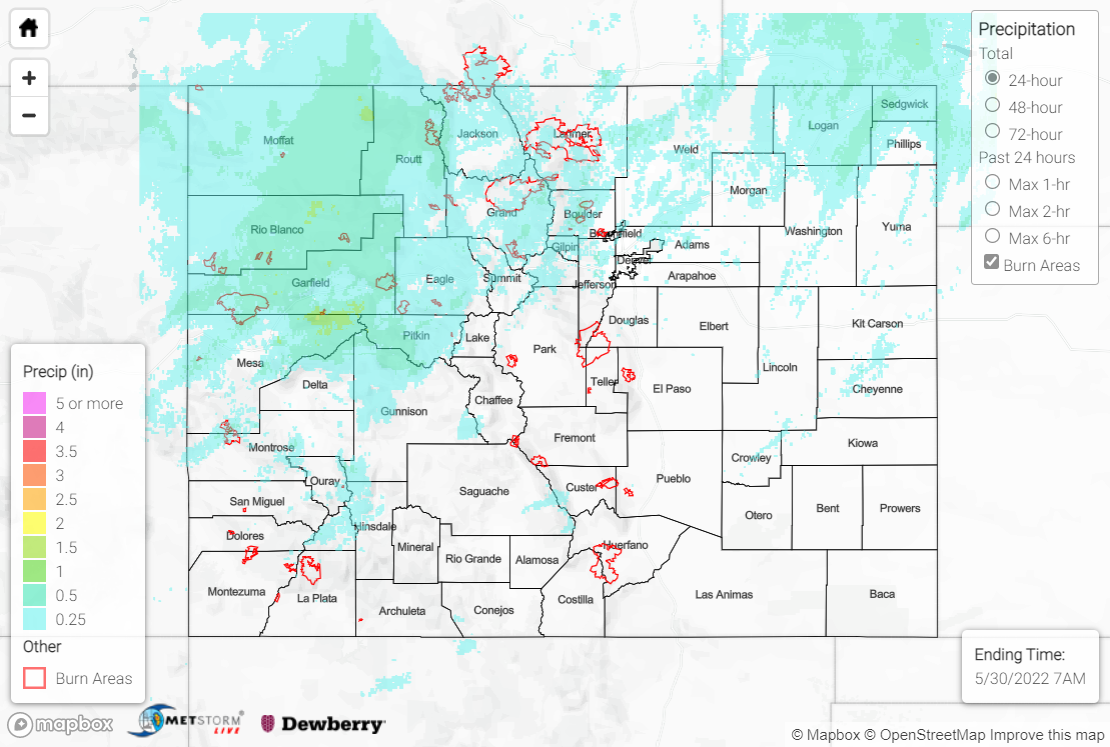
Sunday saw precipitation statewide, with the highest totals across the northern half of the state generally along and north of I-70. An upper-level trough across the western U.S. provided steep lapse rates and modest instability, allowing showers and storms to develop along another front as it tracked southward across the region. There were numerous reports of strong winds and hail associated with the showers and storms, including thunderstorm wind gusts in excess of 60 mph near Alamosa and hail up to 0.75” diameter near Vail and Grand Junction. Below is a video of hail falling just outside of Denver in Lakewood:
#Hail in Lakewood, Colorado!!#weather #Colorado @weatherchannel pic.twitter.com/SLEllq9Es0
— Michael (@MichaelinPhilly) May 29, 2022
Precipitation totals were generally confined to 0.25-0.50”, although amounts approaching and exceeding 1” were reported by CoCoRaHS observers in Garfield and Routt counties. A maximum of 1.22” was reported near New Castle. Several high elevation locations saw their precipitation in the form of convective snow showers, but totals were light with a maximum of 3.8” reported near Silverthorne.
Sunday also saw a continuation of high winds across the state outside of the thunderstorm activity. A non-thunderstorm wind gust of 83 mph was reported in Gunnison County near Wuanita Hot Springs! Several other non-thunderstorm gusts of 60+ mph were reported. As such, critical fire weather continued with Red Flag Warnings south of I-70.
There was no flooding reported yesterday. For precipitation estimates in your area over the last few days, check out the map below.
