Issue Date: Wednesday, May 25th, 2022
Issue Time: 9:45 AM MDT
Summary:
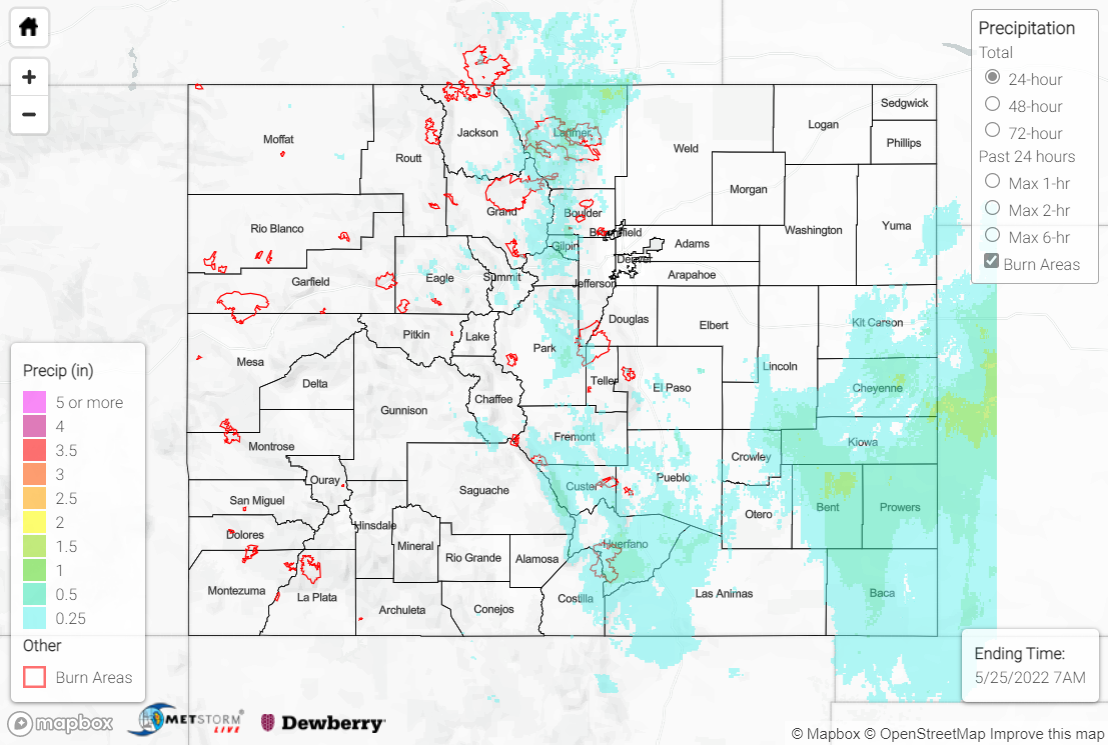
The upper-level trough responsible for our weather on Monday remained slow to depart the region on Tuesday, producing the final day of a prolonged stretch of cool and wet weather across the state. Once again, large-scale ascent and northerly upslope flow combined to produce rain and snow east of the divide. Rainfall amounts along the urban corridor were generally 0.25” or less, while the southeastern plains saw heavier rainfall totals approaching and exceeding 1”, especially Bent, Prowers, and Baca counties. A CoCoRaHS observer in Holly near the Kansas border reported 1.08” of rainfall, which was the highest precipitation total across the state.
Snowfall yesterday was confined to the high country along the urban corridor, where the previously dwindling snowpack was once again replenished with fresh powder. The central Front Range saw over half a foot, with 8.6” reported by CoCoRaHS observers near both Nederland and Dumont. The rest of the high country saw a trace to a few inches at most. The fresh snowpack on Pikes Peak was easily visible in the clear skies this morning behind yesterday’s departing storm system:
Hard to beat this view! Sun hitting a freshly snow-covered Pikes Peak! Can’t wait for the photos we’ll get of the @AFThunderbirds flying in front of the mountain later today! #cowx pic.twitter.com/f7hyHP2I7f
— Sam Schreier (@SamASchreier) May 25, 2022
Precipitation rates on Tuesday were generally light to moderate. Several streams, creeks and rivers across the state, most notably the Arkansas River at Las Animas, are running above normal after the precipitation the past few days, but none are in flood stage.
There was no flooding reported yesterday. For precipitation estimates in your area over the last few days, check out the map below.
