Issue Date: Tuesday, May 24th, 2022
Issue Time: 11:30 AM MDT
Summary:
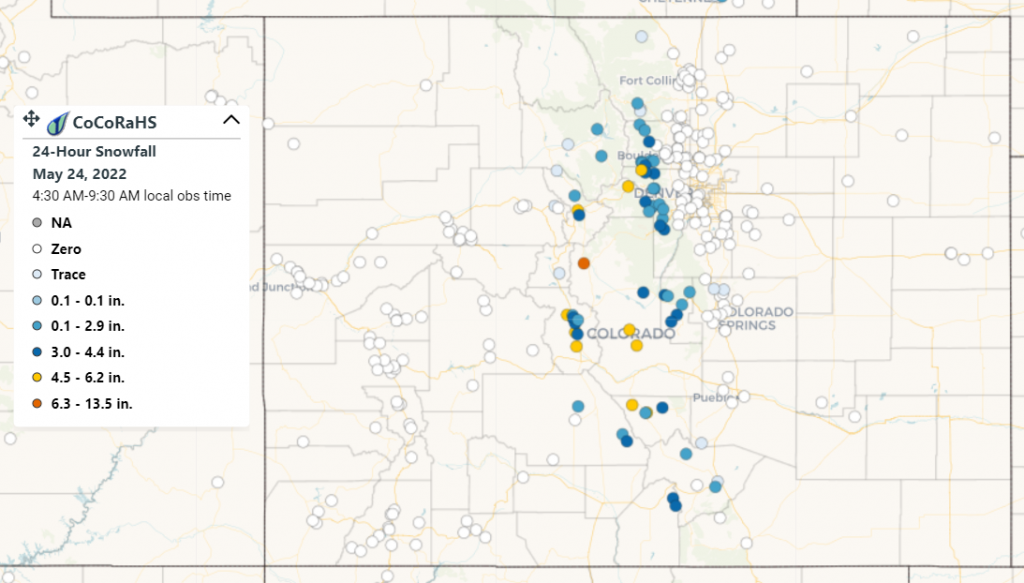
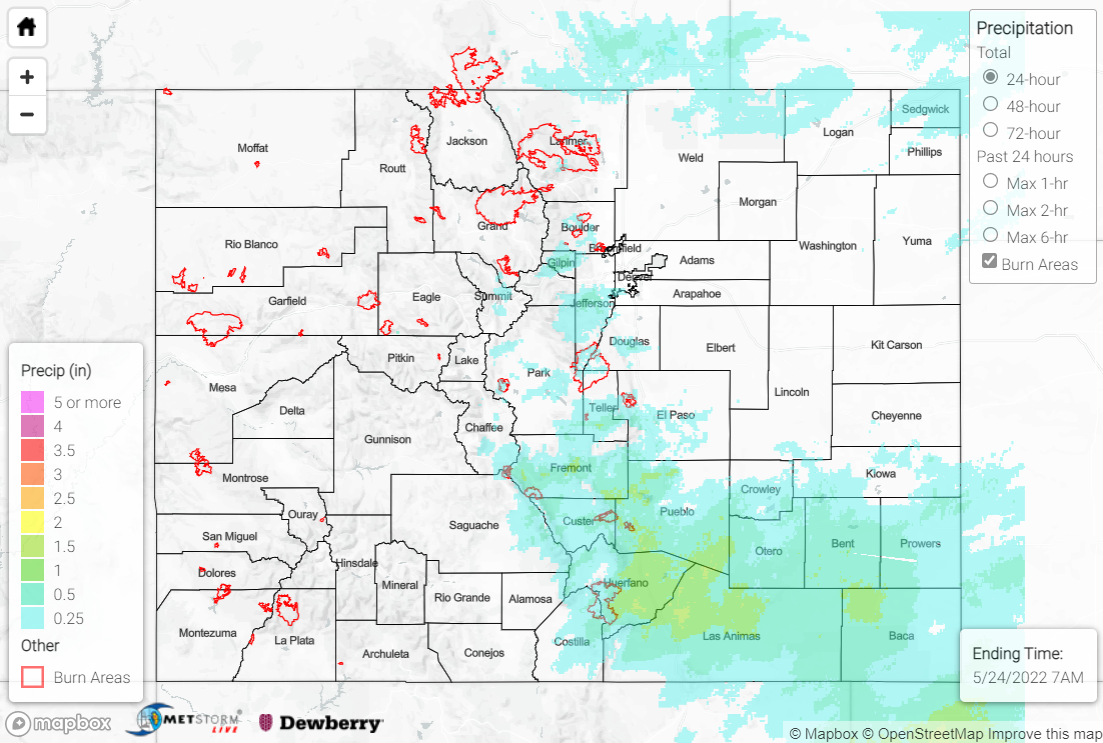
Monday saw another cool and wet day east of the continental divide, as an expansive upper-level trough continued to dominate the weather across much of the intermountain west. Large-scale ascent associated with this trough, as well as upslope flow at the surface across the eastern plains, combined to create widespread rain and snow. While precipitation lingered throughout much of the day, especially across the southeastern quadrant of the state, precipitation intensity remained light to moderate due to the lack of convection. Snowfall was confined to the high elevations west of I-25 and east of the divide, with minimal travel impacts owing to the relatively mild air and ground temperatures this time of year.
Precipitation along the northern urban corridor generally ranged from 0.25-0.75”, with most of this falling as rain. A few higher elevation locations in the north saw heavier totals nearing and exceeding 1”, including CoCoRaHS reports of 1.20” near Fairplay and 1.73” near Buena Vista, although most of this precipitation fell as snow. The highest precipitation totals were observed across the southern urban corridor and the southeastern plains of Huerfano, Las Animas, and Baca Counties, with widespread totals exceeding 1” and approaching 1.50″; this is where the most persistent precipitation was observed over the last 24 hours.
As mentioned above, high elevations received yet another late season boost to their declining snowpack. The highest snowfall amounts per CoCoRaHS were observed in the vicinity of South Park, with totals ranging from half a foot to a maximum of 13.5” near Fairplay; outside of this area, locations generally saw only a trace to several inches.
5 inches new this morning and two feet in four days. Even more snow in the forecast tonight. #cowx #ABasin #Thelegend #maybasin pic.twitter.com/F6XxZGBqOA
— Arapahoe Basin (@Arapahoe_Basin) May 24, 2022
There was no flooding reported yesterday. For precipitation estimates in your area over the last few days, check out the map below.

