Issue Date: Wednesday, May 18th, 2022
Issue Time: 10:00 AM MDT
Summary:
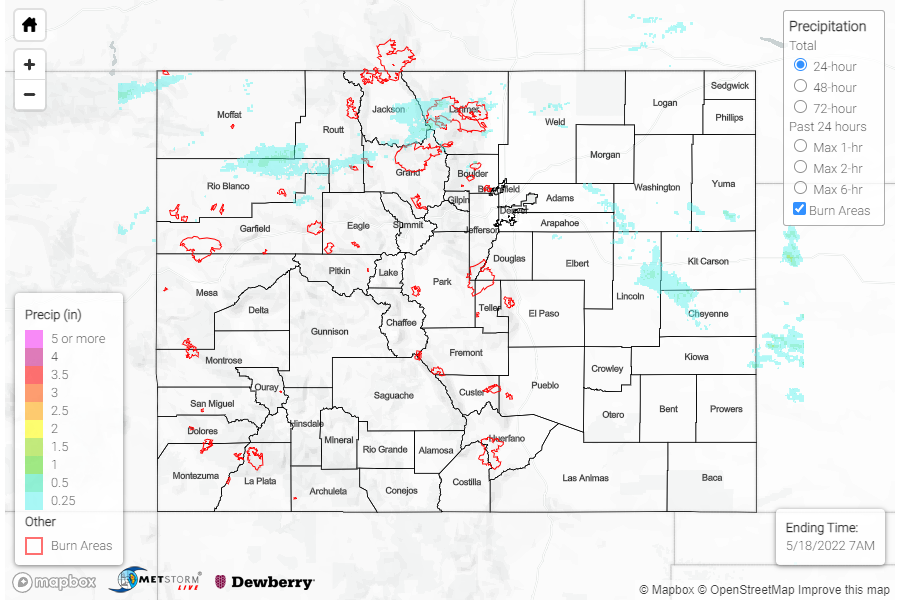
Yesterday afternoon, scattered storms began to develop along a boundary and associated plume of higher moisture draped across Northern Colorado, extending from the Northwest Slope to the Northeast Plains. Overall precipitation totals were modest, but 0.01-0.20 inch observations were reported across Northern Colorado. By evening, storms had increased in coverage and spread onto the Palmer Ridge and portions of the Southeast Plains as well, while the rest Southern Colorado remained largely warm and dry.
As discussed in the FTB yesterday, the threat of severe weather was greater than the threat of heavy rainfall from these storms. Idalia in Yuma County saw the highest rainfall total yesterday – 0.34 from a CoCoRaHS observer, but there were also reports of 1-inch tree limbs broken and shingles blown off from high winds. Elsewhere, thunderstorms produced gusty outflow winds, including a 48-mph gust in Meeker and 54-mph in Glenwood Springs. On the Eastern Plains, a severe thunderstorm warning was issued along the Kansas border, which caused a 60-mph wind gust in Firstview in Cheyenne County.
In other weather news, a fire started yesterday afternoon near Pagosa Springs in the San Juan Mountains, now called the Plumtaw Fire. More information about that fire is seen in the tweet from the Forest Service below. On a more positive note, the High Park Fire is now 69% contained as of last night.
The #PlumtawFire is burning 7 miles north of Pagosa Springs on the #SanJuanNF. Follow InciWeb for complete info: https://t.co/qOPd9p1Yj8. Overnight, the fire reached Fourmile Rd, and firefighters tied it into Plumtaw Road. Today, priority is holding the fire west of Fourmile Rd. pic.twitter.com/ym6XC5LFUl
— SanJuanNF (@SanJuanNF) May 18, 2022
There were no flood reports yesterday. For rainfall estimates in your area check out the MetStorm Live QPE below.
