Issue Date: Tuesday, May 3rd, 2022
Issue Time: 10:10 AM MDT
Summary:
The low-pressure system and associated cold front impacting the state’s weather over the last few days continued its eastward progression yesterday. This allowed for morning rain, and even snow, for much of the northeast quadrant of the state. As the day progressed, a general drying trend from west to east followed the exiting system, with precipitation largely ending by late afternoon. Available moisture at the surface from a few days of precipitation and cooler temperatures allowed for fog formation overnight, which has lingered into this morning for the Northeast Plains, Palmer Ridge, and Urban Corridor.
Precipitation totals from yesterday are most impressive in the Northeast Plains, including 1.57 inches from a CoCoRaHS observer in Wray (Yuma County), who also noted “Nice rain turning to snow about 10:30am. Snow melted about 4pm. Heavy frost and fog overnight.” 1.25 inches was reported in Sterling (Logan County) and 0.96 in Burlington (Kit Carson County).
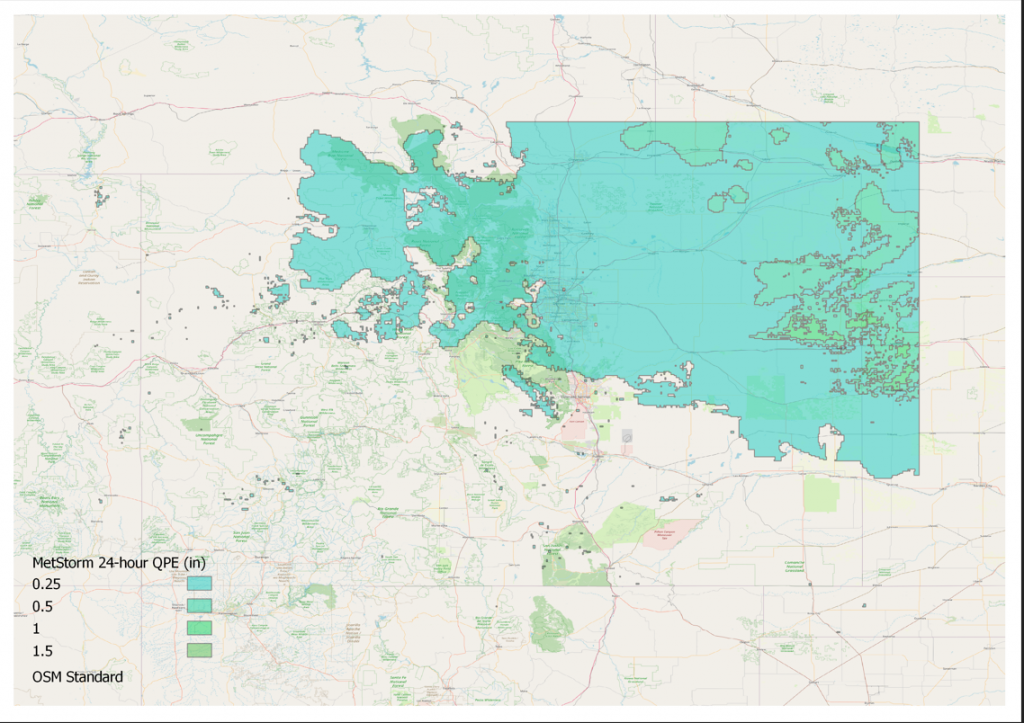
Precipitation totals were more modest to the west along the Urban Corridor and Front Range Mountains. QPE, as seen in the map below, has precipitation totals around 0.25 inches; however, CoCoRaHS and other local gauge networks reports generally range between only 0.0-0.15 inches across the Urban Corridor, with values approaching 0.25 on the eastern edge of the Front Range Mountains.
There were no flood reports yesterday. For rainfall estimates in your area, check out the MetStorm Live QPE below.
