Issue Date: Sunday, May 1st, 2022
Issue Time: 11:35 AM MDT
Summary:
Welcome back to the State Precipitation Map for the 2022 season! The end of April finished uneventfully yesterday in terms of precipitation across the state, though April 2022 has finished as one of the windiest Aprils on record in Denver. To kick off the season, let’s take a look at the state of the snowpack and drought conditions across Colorado.
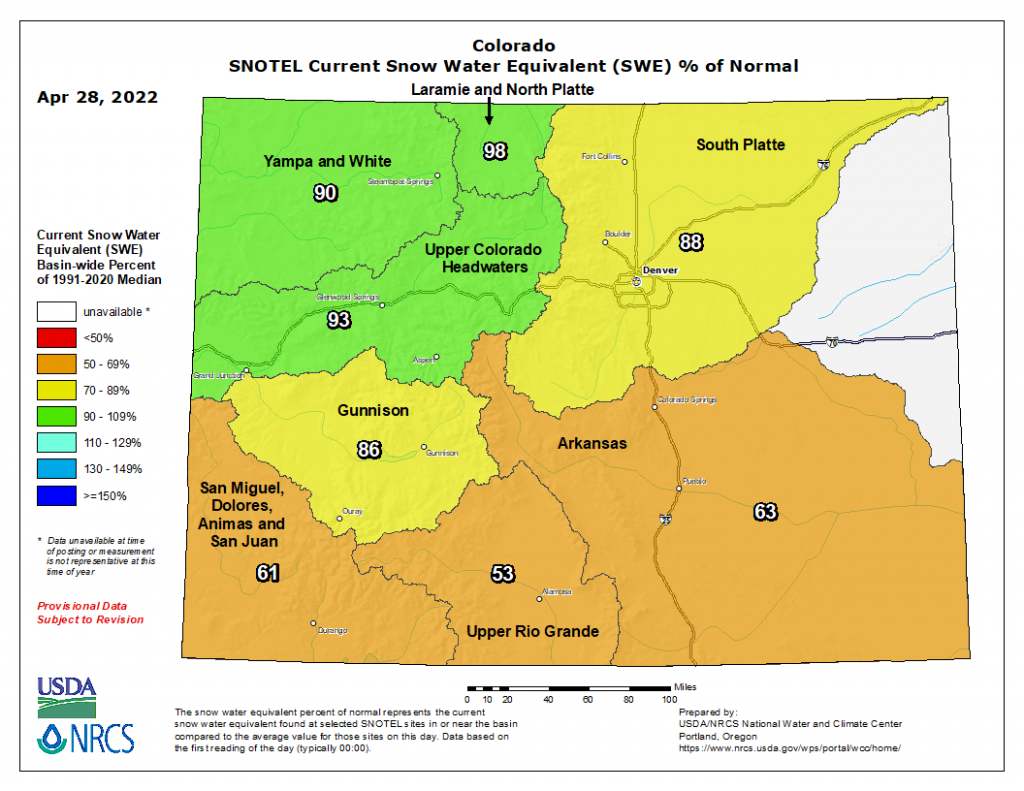
Snowmelt season has begun and as of April 29 statewide snowpack is at 80 percent of the median, according to the NRCS. However, as you can see in the map below of Snow Water Equivalent (SWE), basins in the northern half of the state are faring better than their southern counterparts. The Yampa and White, Laramie and North Platte, and Upper Colorado basins are currently at 90% of SWE or greater, with the South Platte and Gunnison Basins not far behind. However, in Southern Colorado the Arkansas, San Miguel-Dolores-Animas-San Juan, and Upper Rio Grande basins are between only 53-63% of normal.
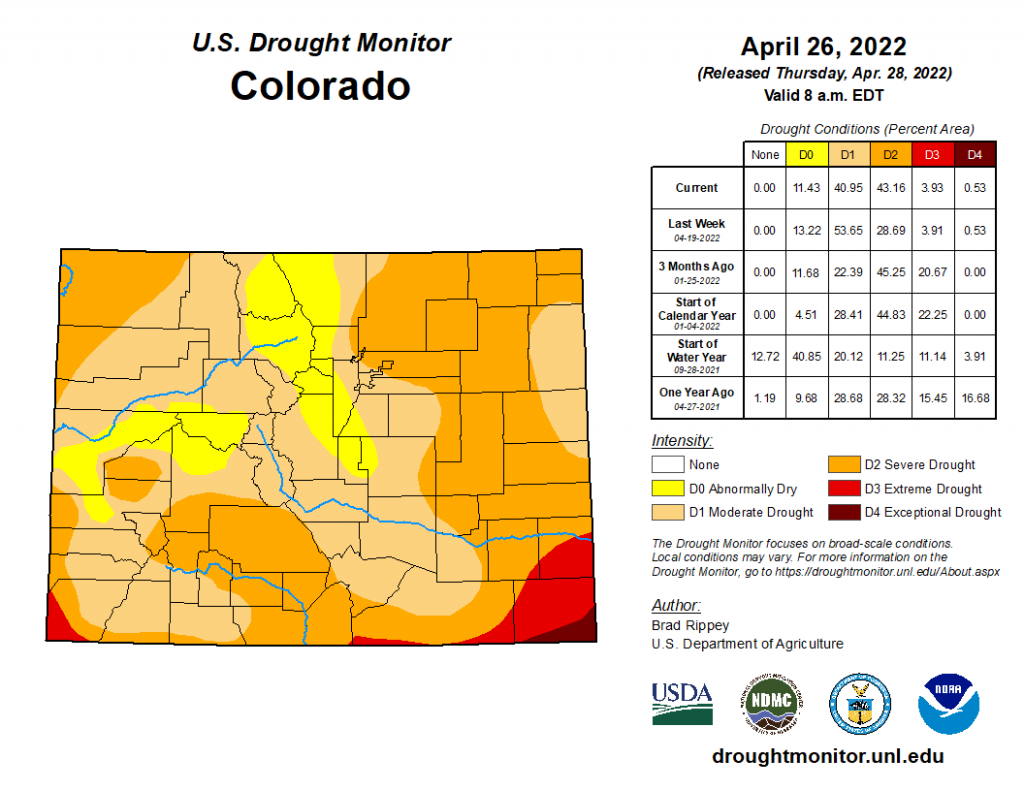
According to the latest map from the US Drought Monitor below, the entire state is experiencing drought conditions in some form. This ranges from Abnormally Dry (D0) conditions for portions of the Northern, Central, and Front Range Mountains, along with the Grand Valley, all the way to Exceptional Drought (D4) on the Southeast Plains. The vast majority of the state, over 80% in total area, is experiencing Moderate (D1) to Severe (D2) Drought.
While the current state of snowpack and drought may paint a bleak picture for the upcoming warm season, look to each day’s Flood Threat Bulletin and twice-weekly Flood Threat Outlooks to understand the potential for extreme rainfall and floods. If you happen to observe flooding this season, be sure to use our “Report a Flood” tool if you can safely do so. Flood reports from the public help verify forecasts and provide important ground-truth to Quantitative Precipitation Estimates.
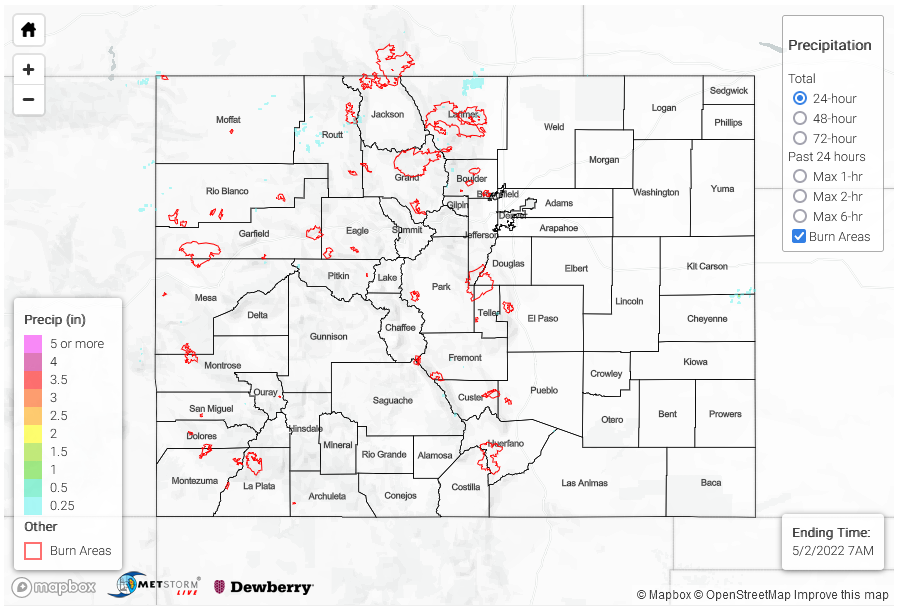
There were no flood or heavy rain reports yesterday. For rainfall estimates in your area, check out the MetStormLive QPE below.
Click Here For Map Overview


