Issue Date: Thursday, September 16th, 2021
Issue Time: 9:45 AM MDT
Summary:
Wednesday saw the return of hot and dry weather across Colorado, and thanks to upper level high pressure over the state there is no rain to report. High temperatures were unseasonably warm yesterday, with 90s along the Urban Corridor and Northeast Plains, and 80s scattered across the high elevations and Western Slopes. In fact, September is on pace to be hottest on record in Denver.
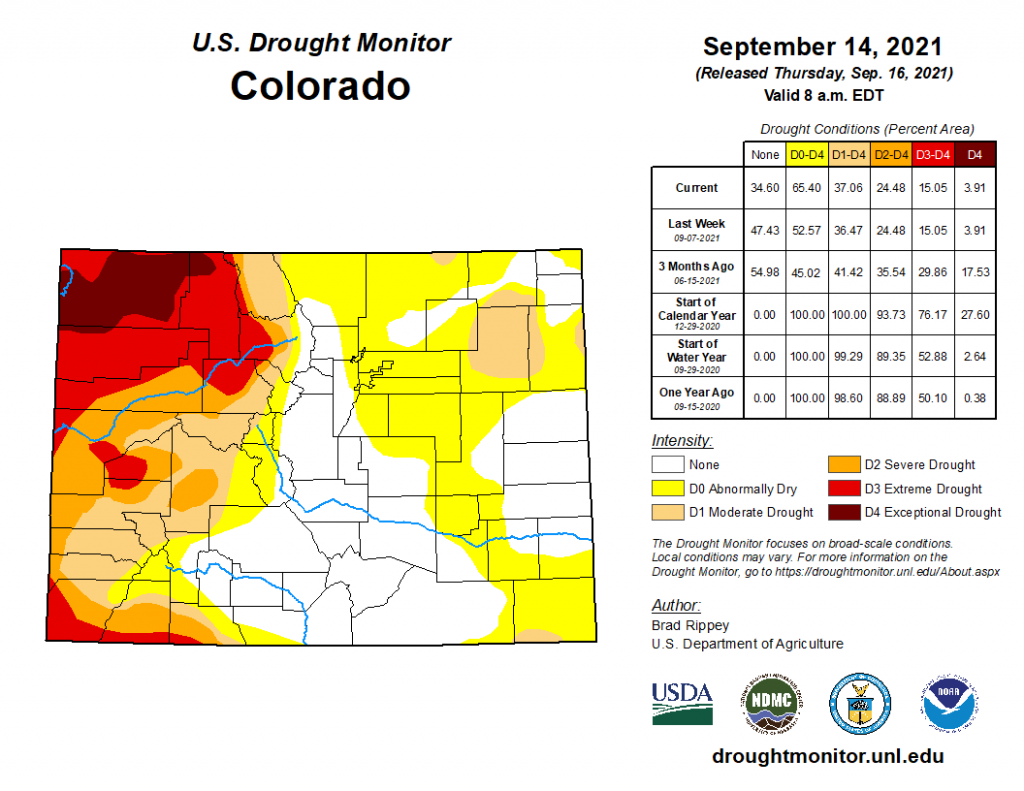
US Drought Monitor updates were published this morning, reflective of conditions up until Tuesday, 9/14, as seen in the map below. There has been no change in drought conditions west of the divide, moderate – exceptional drought still covers the western half other state, aside from areas of the San Juan Mountains and San Luis Valley. In Eastern Colorado, the area of “D0 Abnormally Dry” conditions has greatly increased from last week, up 13% in total area, extending north-south across the state on the Eastern Plains. Last weeks update included the Denver Metro Area, and the latest update now stretches across the Urban Corridor and Northeast Plains. A small area of Baca County on the Oklahoma border is now in “D1 Moderate Drought” as well.
There was no flooding reported on Wednesday. For rainfall estimates in your area, check out the State Precipitation Map below.
The Pueblo radar is currently being upgraded and is offline for the next few weeks, so radar-based precipitation estimates for Southeast Colorado are having to rely on further radars in Denver, New Mexico, Texas, and Kansas. This will result in precipitation being underestimated for this region. More information the radar upgrade can be found here.
Click Here For Map Overview
