Issue Date: Sunday, August 22nd, 2021
Issue Time: 9:50 AM MDT
Summary:
Yesterday saw early morning storms along the Northeast Plains due to a shortwave, however storms dissipated early with daytime heating and the general northeast storm movement exiting the state. As the day progressed, isolated showers developed in the Northwest Slope, Central and Northern Mountains, as another shortwave disturbance traversed the state from the west. Limited instability kept precipitation totals low for most of the region, but up to 0.31 inches fell over the Grizzly Creek burn scar near Glenwood Springs.
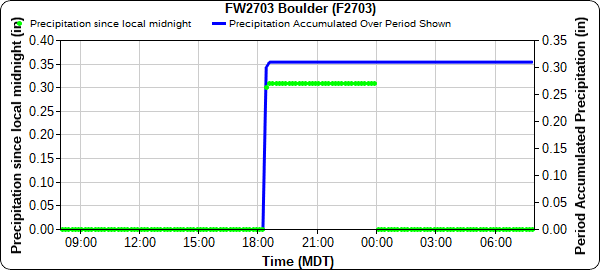
Storms became more organized in the late afternoon along the Front Range Mountains and spilling into the Urban Corridor. An intense storm in Boulder dropped between 0.23-0.37 inches across the north side of town. Some unofficial reports on twitter suggest that rain fell in just a few minutes, and a CoCoRaHS remark at a station in West Boulder reported that the 0.26 observed was “extreme heavy rain for 3 minutes.” A MesoWest gauge in town reported 0.30 inches in 5-minutes (time series plot below) corroborating the reports of a short-lived, intense storm. This amount of rain in Boulder is between a 2-year and 5-year rainfall event (20%-50% chance of occurrence in any given year) according to Precipitation Frequency Estimates from NOAA Atlas 14. The fast moving storm traveled northeast and dropped over half an inch of rain in Longmont as well.
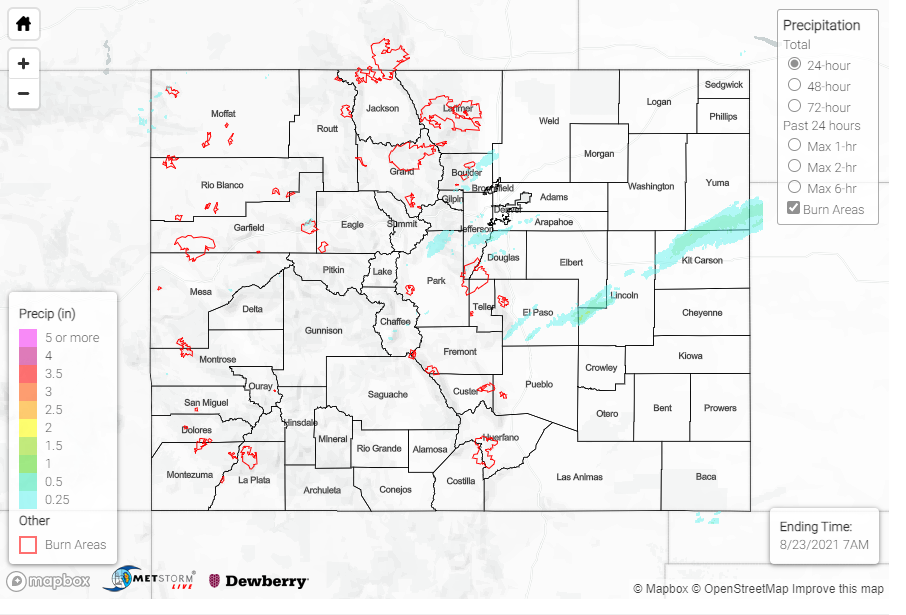
Overnight, a thunderstorm developed along the Palmer Ridge and Northeast Plains which brought over half an inch to locations along its path. A PWS in Kirk in Yuma County reported 0.55 inches from the cell in 2 hours and CoCoRaHS observer in Liberty in Kit Carson County reported 0.93 inches.
No flooding was reported on Saturday. For rainfall estimates in your area, check out the State Precipitation Map below.
Click Here For Map Overview
The map below shows radar-estimated, rainfall gage-adjusted Quantitative Precipitation Estimates (QPE) across Colorado. The map is updated daily during the operational season (May 1 – Sep 30) by 11AM. The following six layers are currently available: 24-hour, 48-hour and 72-hour total precipitation, as well as maximum 1-hour, 2-hour and 6-hour precipitation over the past 24 hour period (to estimate where flash flooding may have occurred). The accumulation ending time is 7AM of the date shown in the bottom right corner. Also shown optionally are vulnerable fire burn areas (post 2012), which are updated throughout the season to include new, vulnerable burn areas. The home button in the top left corner resets the map to the original zoom.
