Issue Date: Saturday, August 21st, 2021
Issue Time: 9:25 AM MDT
Summary:
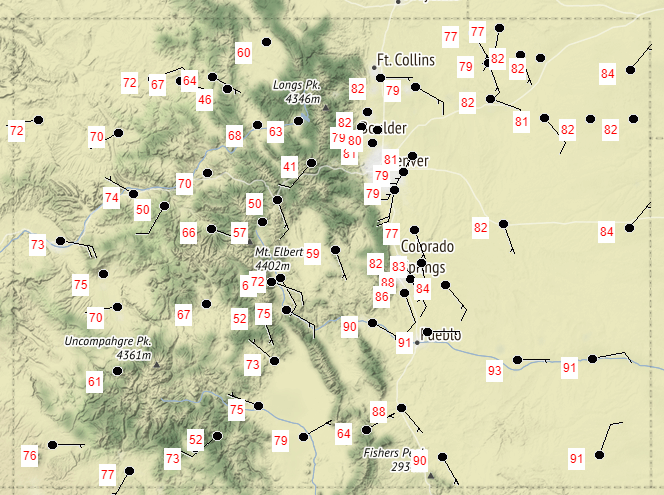
Late Thursday and early Friday’s cold frontal passage ushered in cooler and dryer air, effectively shutting down the heavy precipitation observed over the last few days. It also helped to clear out the air from some of the smoke and haze from western fires and general summer ozone pollution. Temperatures felt more like fall, with highs in the 70s and 80s for most of the state – only the Southeast Plains and Raton Ridge, which didn’t benefit from much rain over the last few days, remained in the 90s. The map below shows the 24-hour maximum temperature from yesterday at all NWS stations across Colorado.
There were still some very early morning residual showers in the Northeast Plains, and as of 7:30 yesterday morning flooding was still being reported after Thursday night’s extreme rainfall in Holyoke and the surrounding area. The flood warning issued overnight for the area expired at noon.
As mentioned in the FTB yesterday, there was the potential for an overnight disturbance along the Raton Ridge, Southeast Plains, and Palmer ridge last night. This materialized and allowed for a line of showers to develop, producing modest rainfall as showers moved north-northeast. A gauge in Colorado City reported 0.10 inches just after midnight, and 0.01-0.03 inches were reported along the I-70 corridor of the Palmer Ridge and Eastern Plains.
For rainfall estimates in your area, especially over the last few days, check out the State Precipitation Map below!
Click Here For Map Overview
The map below shows radar-estimated, rainfall gage-adjusted Quantitative Precipitation Estimates (QPE) across Colorado. The map is updated daily during the operational season (May 1 – Sep 30) by 11AM. The following six layers are currently available: 24-hour, 48-hour and 72-hour total precipitation, as well as maximum 1-hour, 2-hour and 6-hour precipitation over the past 24 hour period (to estimate where flash flooding may have occurred). The accumulation ending time is 7AM of the date shown in the bottom right corner. Also shown optionally are vulnerable fire burn areas (post 2012), which are updated throughout the season to include new, vulnerable burn areas. The home button in the top left corner resets the map to the original zoom.

