Issue Date: Tuesday, August 17th, 2021
Issue Time: 9:40 AM MDT
Summary:
Monday saw another day of afternoon showers and thunderstorms in the Southwest Slope, the only region in the state with notable, widespread precipitation. Some of the higher totals include:
- 0.43 inches from CoCoRaHS observer in Mancos, who indicated heavy rain from 3:10 to 4:20 pm
- 0.25 inches from CoCoRaHS observer north of Durango, also from an afternoon storm
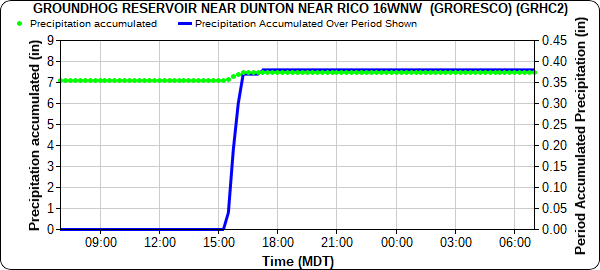
- 0.38 inches at Groundhog Reservoir (time series plot below), which corroborate both CoCoRaHS observations with most of the rain falling in the 3:00 pm hour
Elsewhere in Colorado, scattered showers fired up in the high elevations of the Northern and Central Mountains as the afternoon progressed. Pockets of higher accumulations were observed for areas lucky enough to be under a convective cell, though most of the mountains stayed dry. Small areas of the East Troublesome and Cameron Peak burn scars had flash flood warnings issued yesterday afternoon. Meteorologist Chris Bianchi shared the following radar reflectively loop on twitter showing the isolated, flash flood-warned cells near each burn scar (green polygons). Up to 0.25 inches total fell in the small areas, based on gridded QPE from MetStormLive.
Small slivers of the East Troublesome and Cameron Peak burn scars are flash flood-warned. #9wx #COwx pic.twitter.com/0nZrgJbY5r
— Chris Bianchi (@BianchiWeather) August 16, 2021
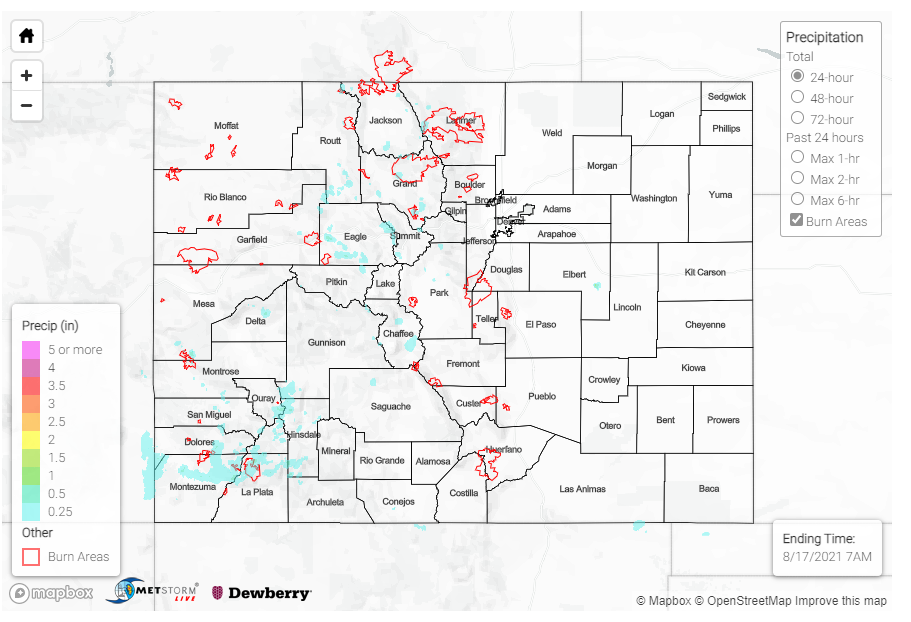
No flooding was reported on Monday. For rainfall estimates in your area, check out the State Precipitation Map below.
Click Here For Map Overview
The map below shows radar-estimated, rainfall gage-adjusted Quantitative Precipitation Estimates (QPE) across Colorado. The map is updated daily during the operational season (May 1 – Sep 30) by 11AM. The following six layers are currently available: 24-hour, 48-hour and 72-hour total precipitation, as well as maximum 1-hour, 2-hour and 6-hour precipitation over the past 24 hour period (to estimate where flash flooding may have occurred). The accumulation ending time is 7AM of the date shown in the bottom right corner. Also shown optionally are vulnerable fire burn areas (post 2012), which are updated throughout the season to include new, vulnerable burn areas. The home button in the top left corner resets the map to the original zoom.

