Issue Date: Sunday, August 1st, 2021
Issue Time: 11AM MDT
Summary:
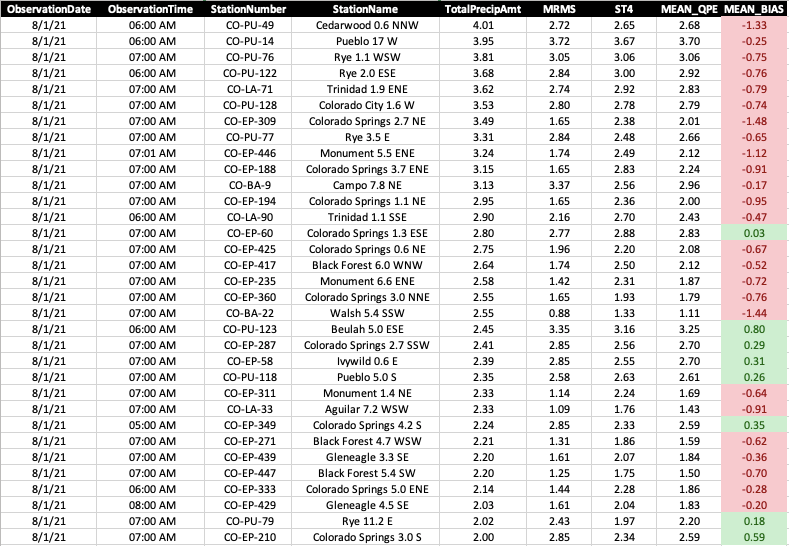
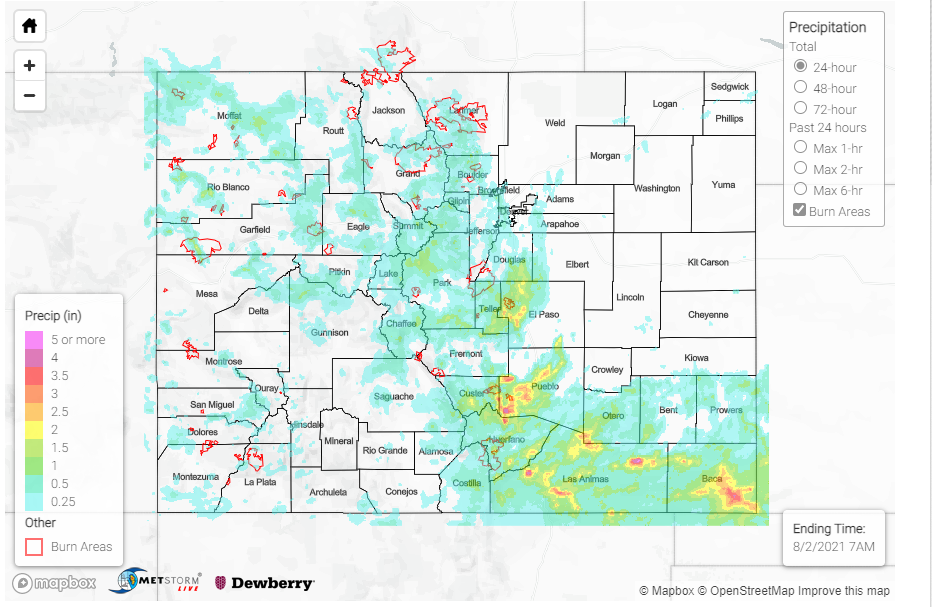
The long awaited intense rainfall event finally came and went on Saturday, and generally speaking, lived up to its expectations. By far the most intense rainfall occurred over southeast Colorado, generally along the I-25 corridor south of Colorado Springs and eastward, along and south of the Arkansas River. Extremely efficient tropical-style rainfall from copious moisture overcame a lack of instability to provide widespread areas with at least 2 inches of rainfall. However, isolated pockets received more than that. Much more. The highest reliable observation came in from near Pueblo with 5.03 inches! A CoCoRaHS observer east of Colorado City (between Pueblo and Walsenburg) reported 4.01 inches. Numerous other reports in the 3-4 inch range also came in from El Paso, Las Animas, Baca and Pueblo counties. As of 10:30AM, eleven reports showed above 3 inches of rain. The highest estimated rainfall was from Baca County where up to 7 inches is shown! However, that area is one of the more difficult parts of the state to estimate because radar beams from various NWS radars measure storms very high above the ground, often leading to overestimates. On the other hand, yesterday’s warm coalescence rainfall actually led to the underestimate of almost all high-end rainfall amounts. See the table below showing that 25 of the highest 33 CoCoRaHS reports were underestimated by our gridded products, some significantly. So, 7 inches is certainly not out of the question.
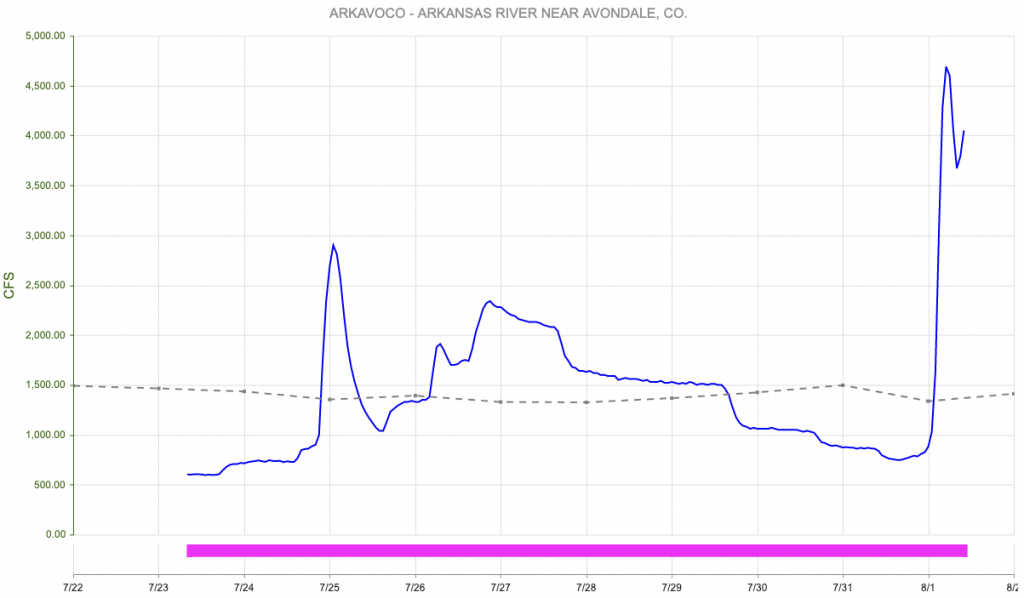
In terms of the hydrologic response, numerous flood reports came in from southeast Colorado. In Baca County, where the highest rainfall in the state probably occurred, a report of 3 feet of water overtopping a road was received from east of Campo. Vehicles were reported stranded in flood water near Colorado Springs. Many reports of flooded roads came in from Pueblo. A long stretch of washed out road was reported south of Walsenburg just west of I-25. In all, runoff trickled into the Fountain Creek, Saint Charles River, Hardscrabble Creek, Huerfano River among other smaller creeks and tributaries to cause a flood wave on the Arkansas River that went from about 600 cfs to over 4,500 cfs in a matter of hours (see below). It is possible that even higher flows will occur downstream in the coming hours as additional sub-basins downstream chip in their share.
Along and west of the Continental Divide, numerous reports of heavy rainfall above 1 inch were received from Rio Blanco, Garfield and Gunnison counties. At least two reports of debris slides and mud flows were received as of this morning. One, from Poncha Pass where Highway 285 was blocked. Another from just outside of Telluride where a “large” mudflow forced the closure of Highway 145.
Finally, it was another active day for fire burn areas across the state. Possibly for the first day thus far, all six fire burns were under a Flash Flood Warning at some point on Saturday afternoon. The most severe outcomes were likely over the Spring Creek and Pine Gulch burns. Over Spring Creek, at least 1.5 inches of rain fell resulting in Highway 421 being overtopped for “hundreds of yards”. Meanwhile, over Pine Gulch, storm chaser Reed Timmer filmed an impressive mud flow on its northeast side. A stone’s throw away on the southwest side of the burn, addition mud flows resulted in evacuation orders for downstream neighborhoods.
In short, the monsoon of 2021 rages on.
For estimates of precipitation in your area, please check our State Precipitation Map below.


