Issue Date: Wednesday, July 28th, 2021
Issue Time: 11AM MDT
Summary:
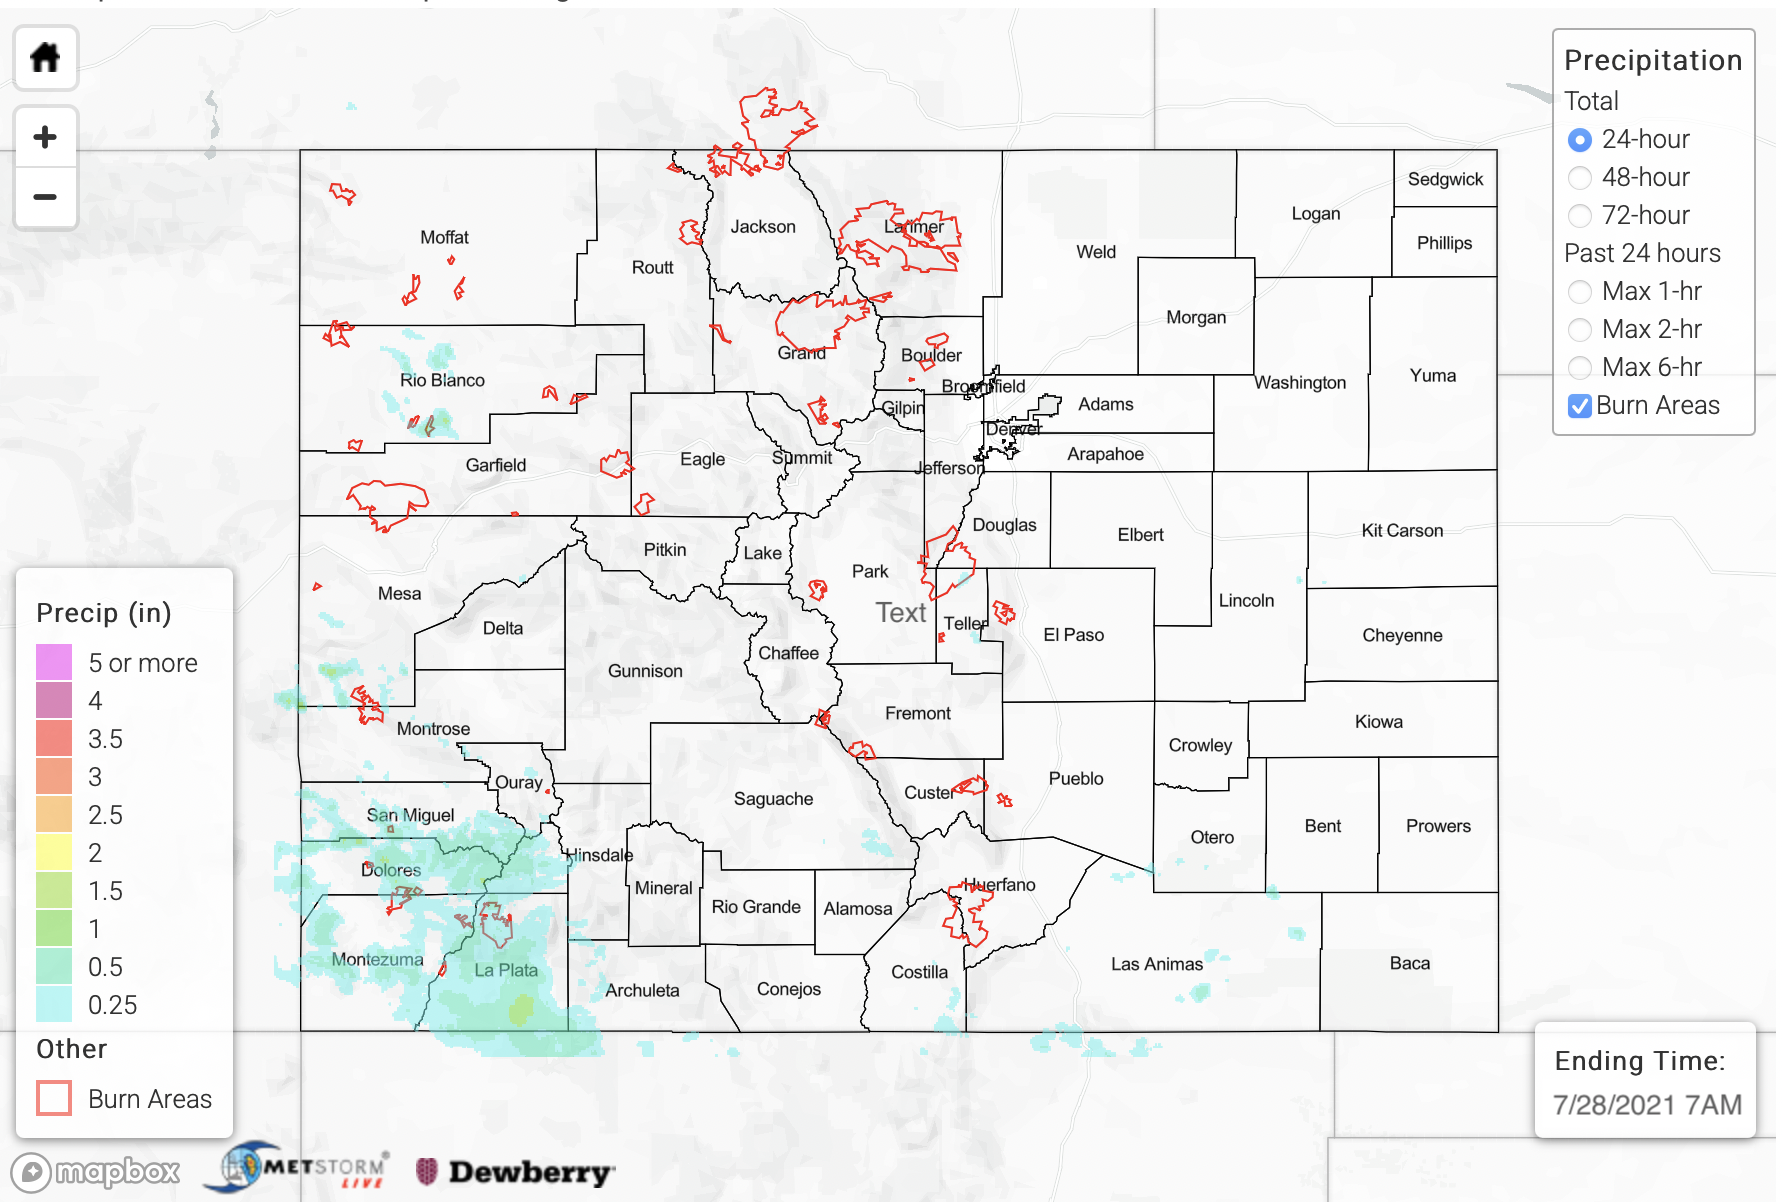
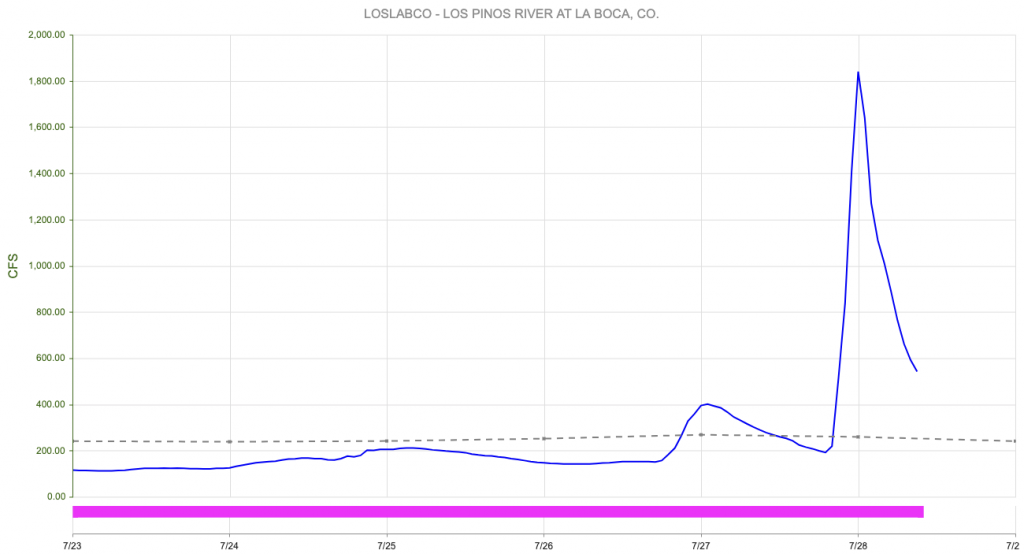
Although rainfall coverage decreased somewhat compared to previous active days, with plenty of monsoonal moisture around, scattered to numerous thunderstorms were once again the norm over parts of the San Juan Mountains. The most impressive complex of storms occurred late in the evening along the New Mexico border where 60-90 minutes of heavy rainfall prompted a Flood Advisory for the area south of Durango. The Durango-La Plata County Airport gage measured a total of 1.34 inches, and best estimates suggest about 1 inch per hour as the peak intensity of the rainfall. However, because the rainfall occurred over a relatively large area, significant runoff resulted in several spikes of regional streams and rivers. The Los Pinos River (at La Boca, shown below) went from about 200 cfs at 7PM to 1,800 cfs at midnight. Just to the west, the Florida River at Bondad went from about 60 cfs at 6PM to over 1,000 cfs at midnight. And just downstream of Bondad where the Florida meets the Animas River, a spike of several thousand cfs was noted in the evening hours. Keep in mind these estimates are very preliminary and could be adjusted later. However, the flows appear to be consistent with the areal coverage and intensity of heavy rainfall observed yesterday.
Elsewhere, another more isolated storm prompted a Flash Flood Warning to the northeast of the town of Dolores where up to 1.0 inch of rainfall occurred. Finally, as more of a fun fact, Grand Junction received measurable rainfall for the third day in a row, although it was a rather unimpressive 0.01 inch.
For rainfall estimates yesterday and the previous 3-days, please check out our State Precipitation Map, below. Please note that we are aware of underestimates in peak rainfall intensity over the southwest part of the state. This is likely arising from poor radar coverage in the area.
Click Here For Map Overview

