Issue Date: Sunday, July 26th, 2021
Issue Time: 10:45AM MDT
Summary:
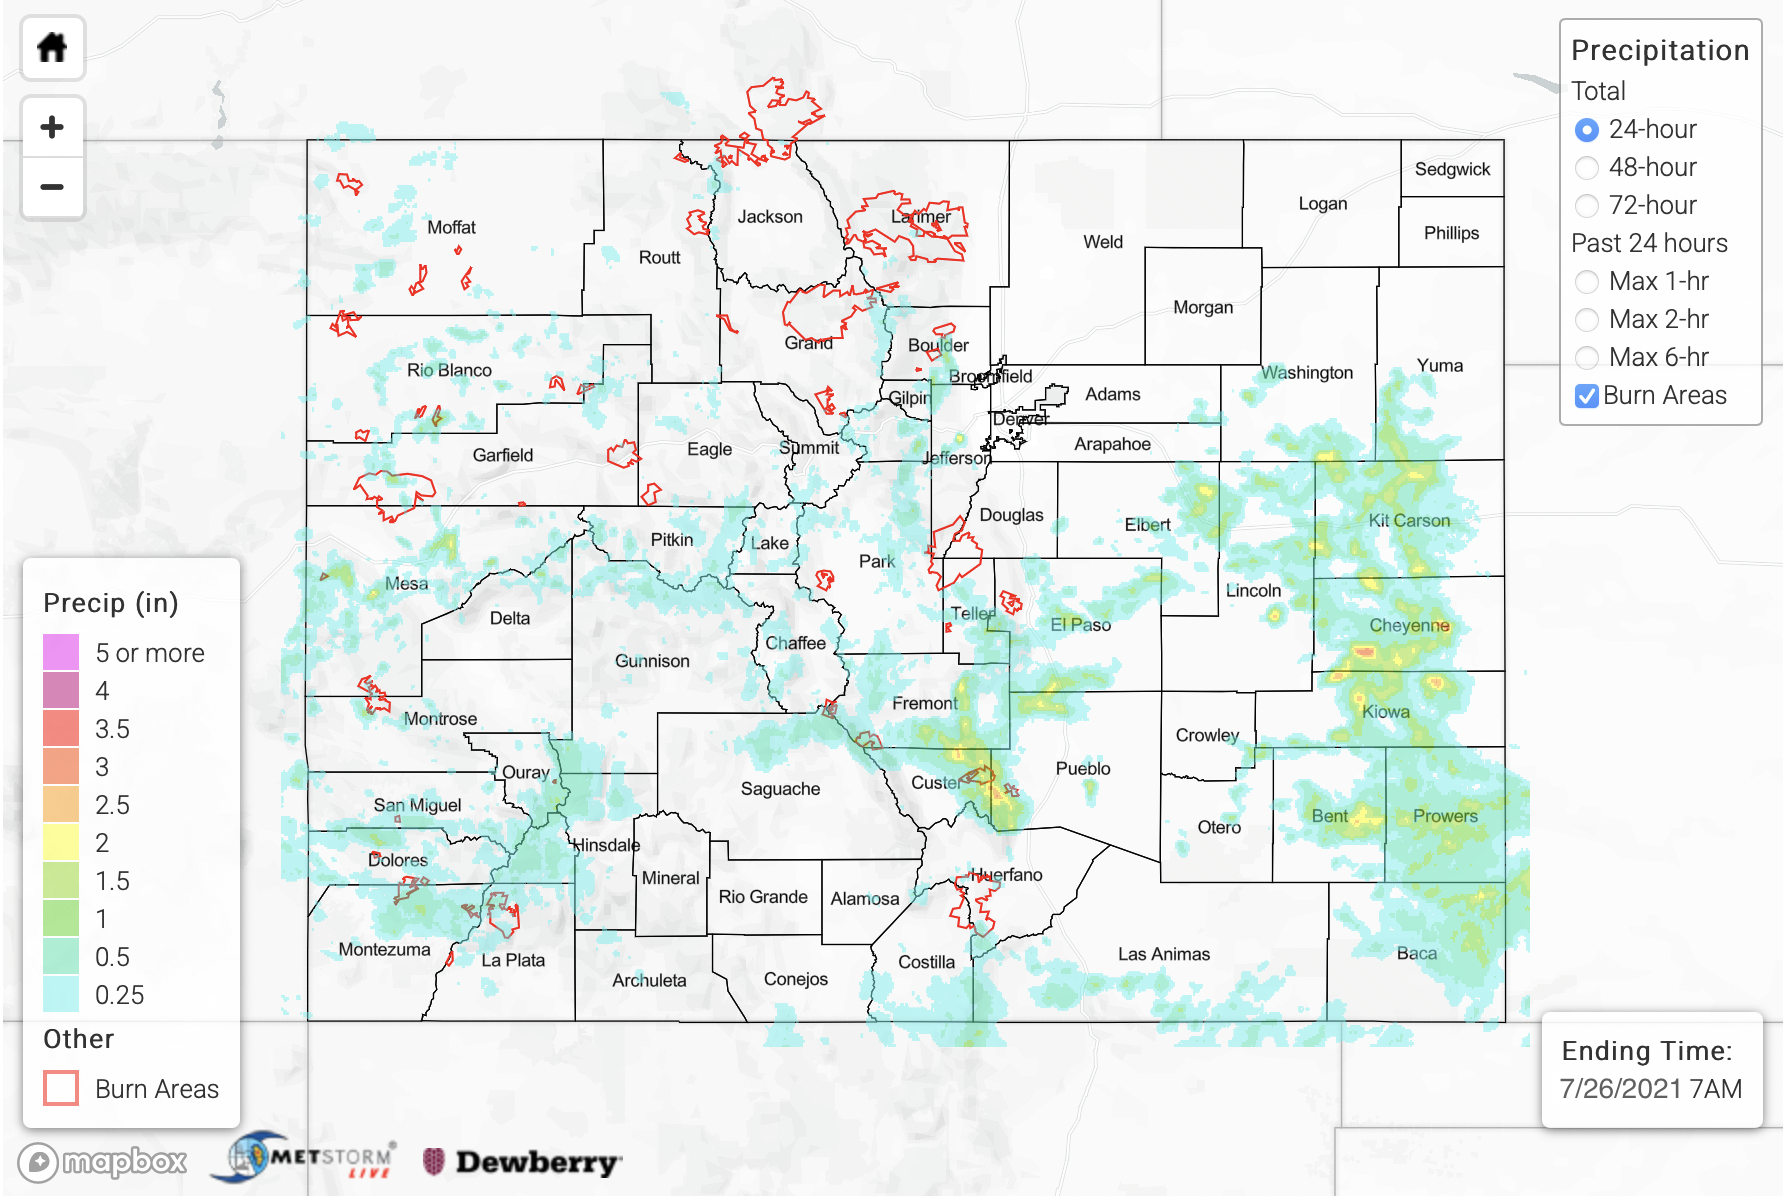
Thirty-five flood-related warnings and advisories were issued across Colorado by area National Weather Service offices on Sunday afternoon and evening. And unlike the past several days where the flood threat was generally limited to the higher terrain and foothills, heavy rainfall was also observed over the Northeast Plains and Southeast Plains. Below we separate particularly notable rainfall and flooding into 3 areas.
1) Northeast Plains and Southeast Plains. In terms of overall intensity, it appears the complex of storms over Kit Carson, Cheyenne and Kiowa counties was the strongest. Radar estimated amounts in excess of 3 inches look legitimate, as a few CoCoRaHS observations in the area reported just under 3 inches. Extremely high dewpoint temperatures exceeding 65F supported very strong instability while steering flow was strong enough to keep storms moving, slowly, but not fast enough to limit point accumulation. Most of the rainfall likely occurred in a 60-90 minute period, or even less. While no official flooding was reported with these storms, this was likely a by-product of the rural setting and limited observations across this part of Colorado.
2) Front Range and Southeast Mountains. Outflow boundaries from the storms further east ignited a somewhat surprising set of new storms along parts of the I-25 corridor, both north and south of the Palmer Divide. To the north, Mile High Flood District gages observed two separate very heavy rainfall cores near Boulder and Morrison. At the Boulder gage, about 1.70inches was recorded in only 20 minutes, making this a 100-200 year event. A CoCoRaHS gage from the area observed 2.41 inches this morning. Fortunately, the very limited spatial extent of the rainfall did not translate to a riverine flooding threat with Boulder Creek only rising a few hundred c.f.s. Further south, more widespread heavy rainfall in and around Canon City prompted numerous Flash Flood warnings. The estimated intensity of the strongest downpours was 2-2.5 inches per hour, but this fell over relatively steep terrain. Several reports of flooding came in with these storms, with the most severe likely being from south of Victor, CO, where the report read “large boulders washed onto Shelf Road Mile Marker 10”. The Arkansas River downstream of Canon City spiked from roughly 1,000 to 3,000 c.f.s. as a result of these storms. Fortunately, that was still below flood stage.
3) Western Slope Along UT border. Storms took their time to get going over the Western Slope yesterday but by evening, slow moving heavy rainfall cores were dotting the landscape along the UT border. Numerous Flash Flood warnings and Flood advisories accompanied the strongest storms, which were producing intensity of 1-1.5 inches per hour. Fortunately, flooding was not officially reported, though, just like the storms over the eastern plains, this is likely due to the very limited population and observations in the area.
Finally, looking at fire burn areas, the Pine Gulch, Grizzly Creek and Spring Creek burn scars went under Flash Flood Warnings during the afternoon and evening. There was a flooding report over the Spring Creek burn scar, noting about 8 inches of water overtopping Road 431. However, given what we know about this older burn scar, it is unclear if this was due to the fire burn itself or just from the heavy rainfall, which measured 0.94 inches in 45 minutes at a closely situated USGS gage.
For rainfall estimates yesterday and the previous 3-days, please check out our State Precipitation Map, below.
Click Here For Map Overview
Note: The 24-hour, 48-hour and 72-hour total precipitation do not contain bias corrections today due to errors in the CoCoRaHS data. This means there may be underestimations in QPE over the southwest and southeast corners of the state.
